

Project A · Research program · originally scoped at 14–18 months
Topological Data Analysis in Quantitative Trading
Project started 2026-05-08 · Last updated 2026-05-14
View previous versionsSix macro phases shipped on a compressed timeline, through the H3 make-or-break test and now H4 portfolio construction. The original 14–18 month plan was calibrated against a single-researcher cadence; the project is running well ahead of that schedule, and the progress log below carries each phase's actual completion date so a reader can verify the pace independently.
What we did · what worked · what didn't
The central finding
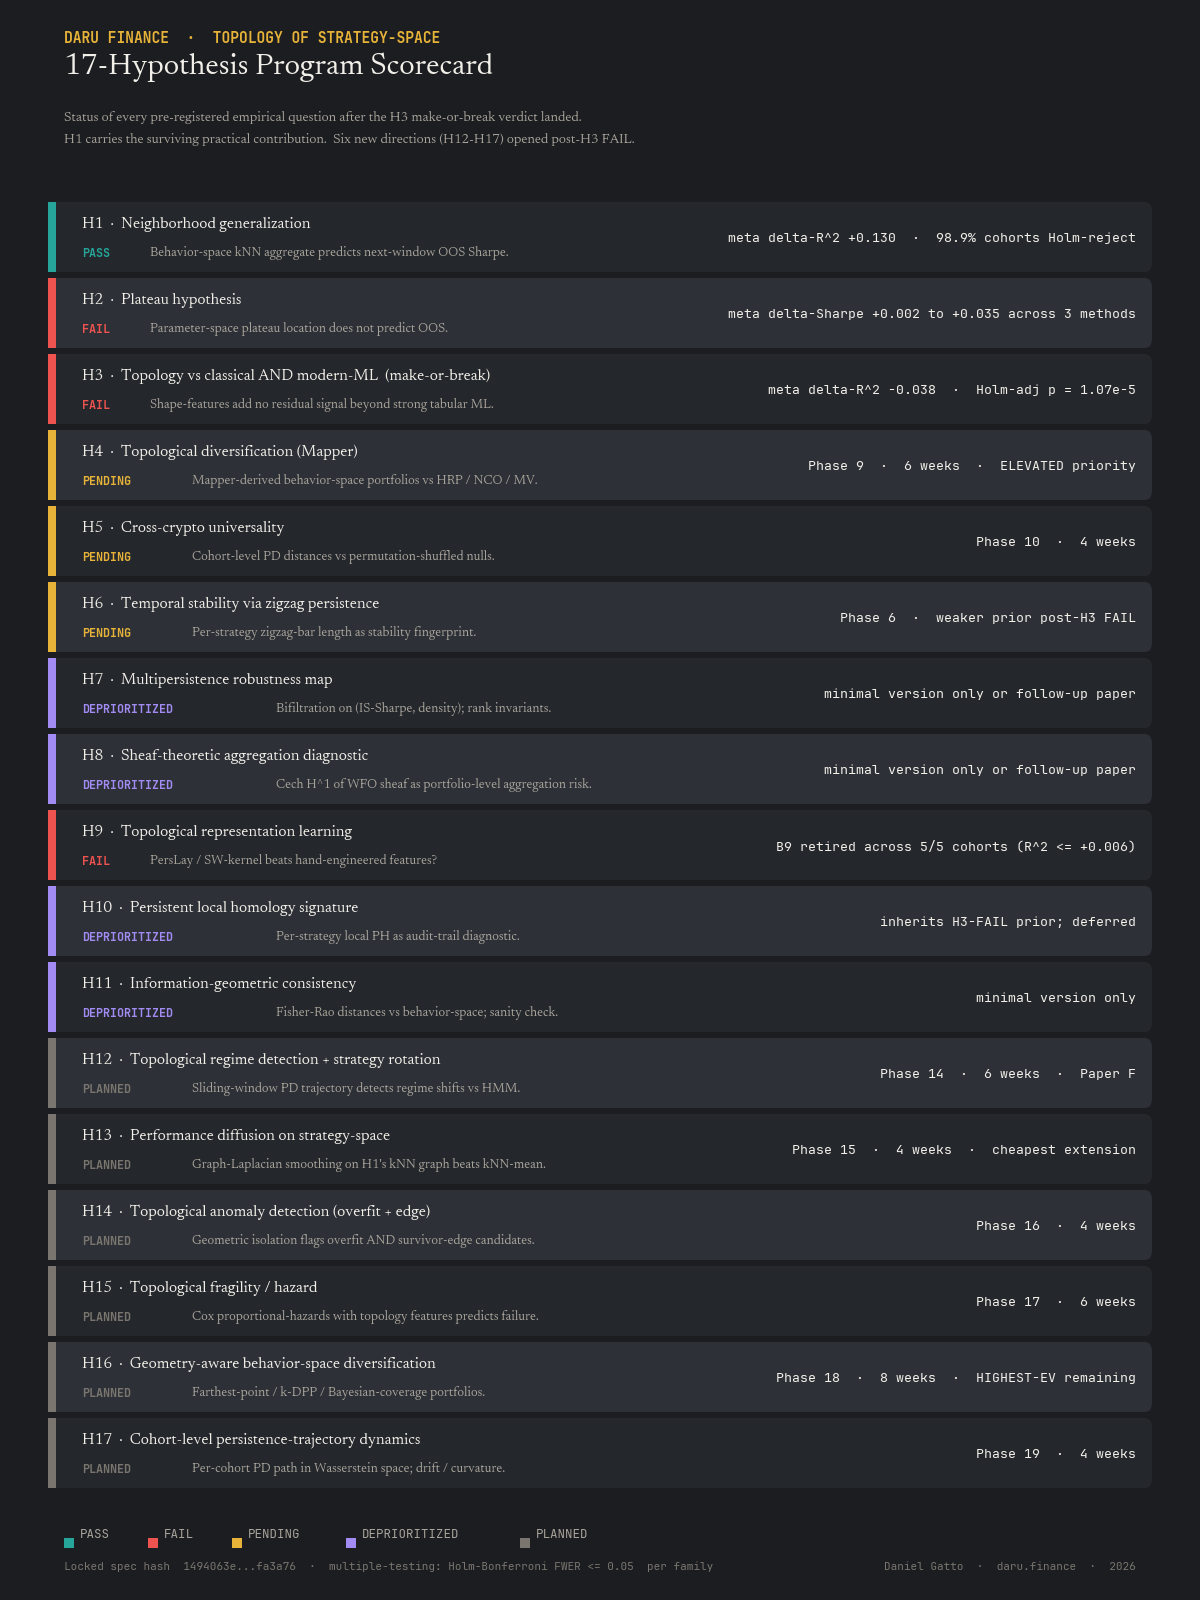
Topology earns its place describing the shape of your strategy universe and deciding over that shape, picking a diversified portfolio, flagging an unsettled cohort, rotating strategies by regime, and only when it adds a structural degree of freedom the standard approach doesn't already have. It does not earn its place forecasting how an individual strategy will perform; the standard scorecard wins there. That prediction-vs-decision partition, refined four times across the program, is the work's central methodological result, and every headline contribution sits on the decision side of it.
What worked
H1: behaviour-space neighbour prediction
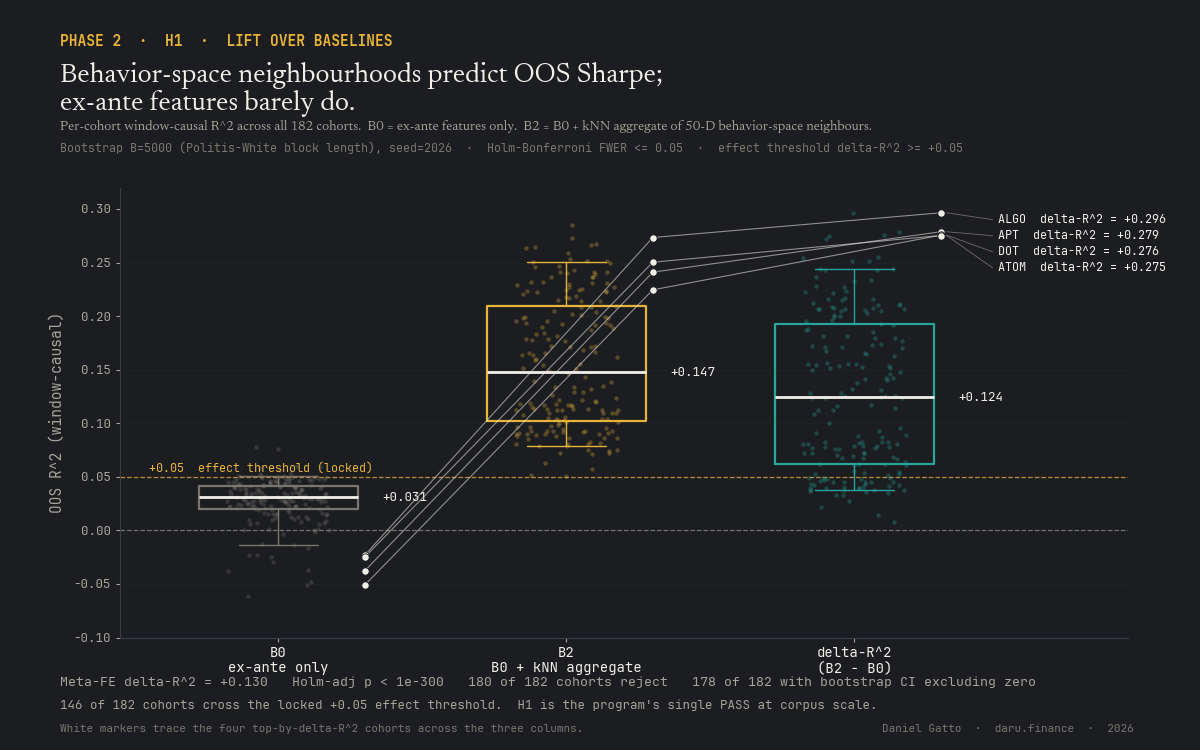
PASSA strategy's nearest behaviour-neighbours predict its next out-of-sample window far better than its own past does, meta ΔR² ≈ +0.13 across 182 cohorts. The foundational signal everything downstream rests on.
H4: topology-aware portfolio construction
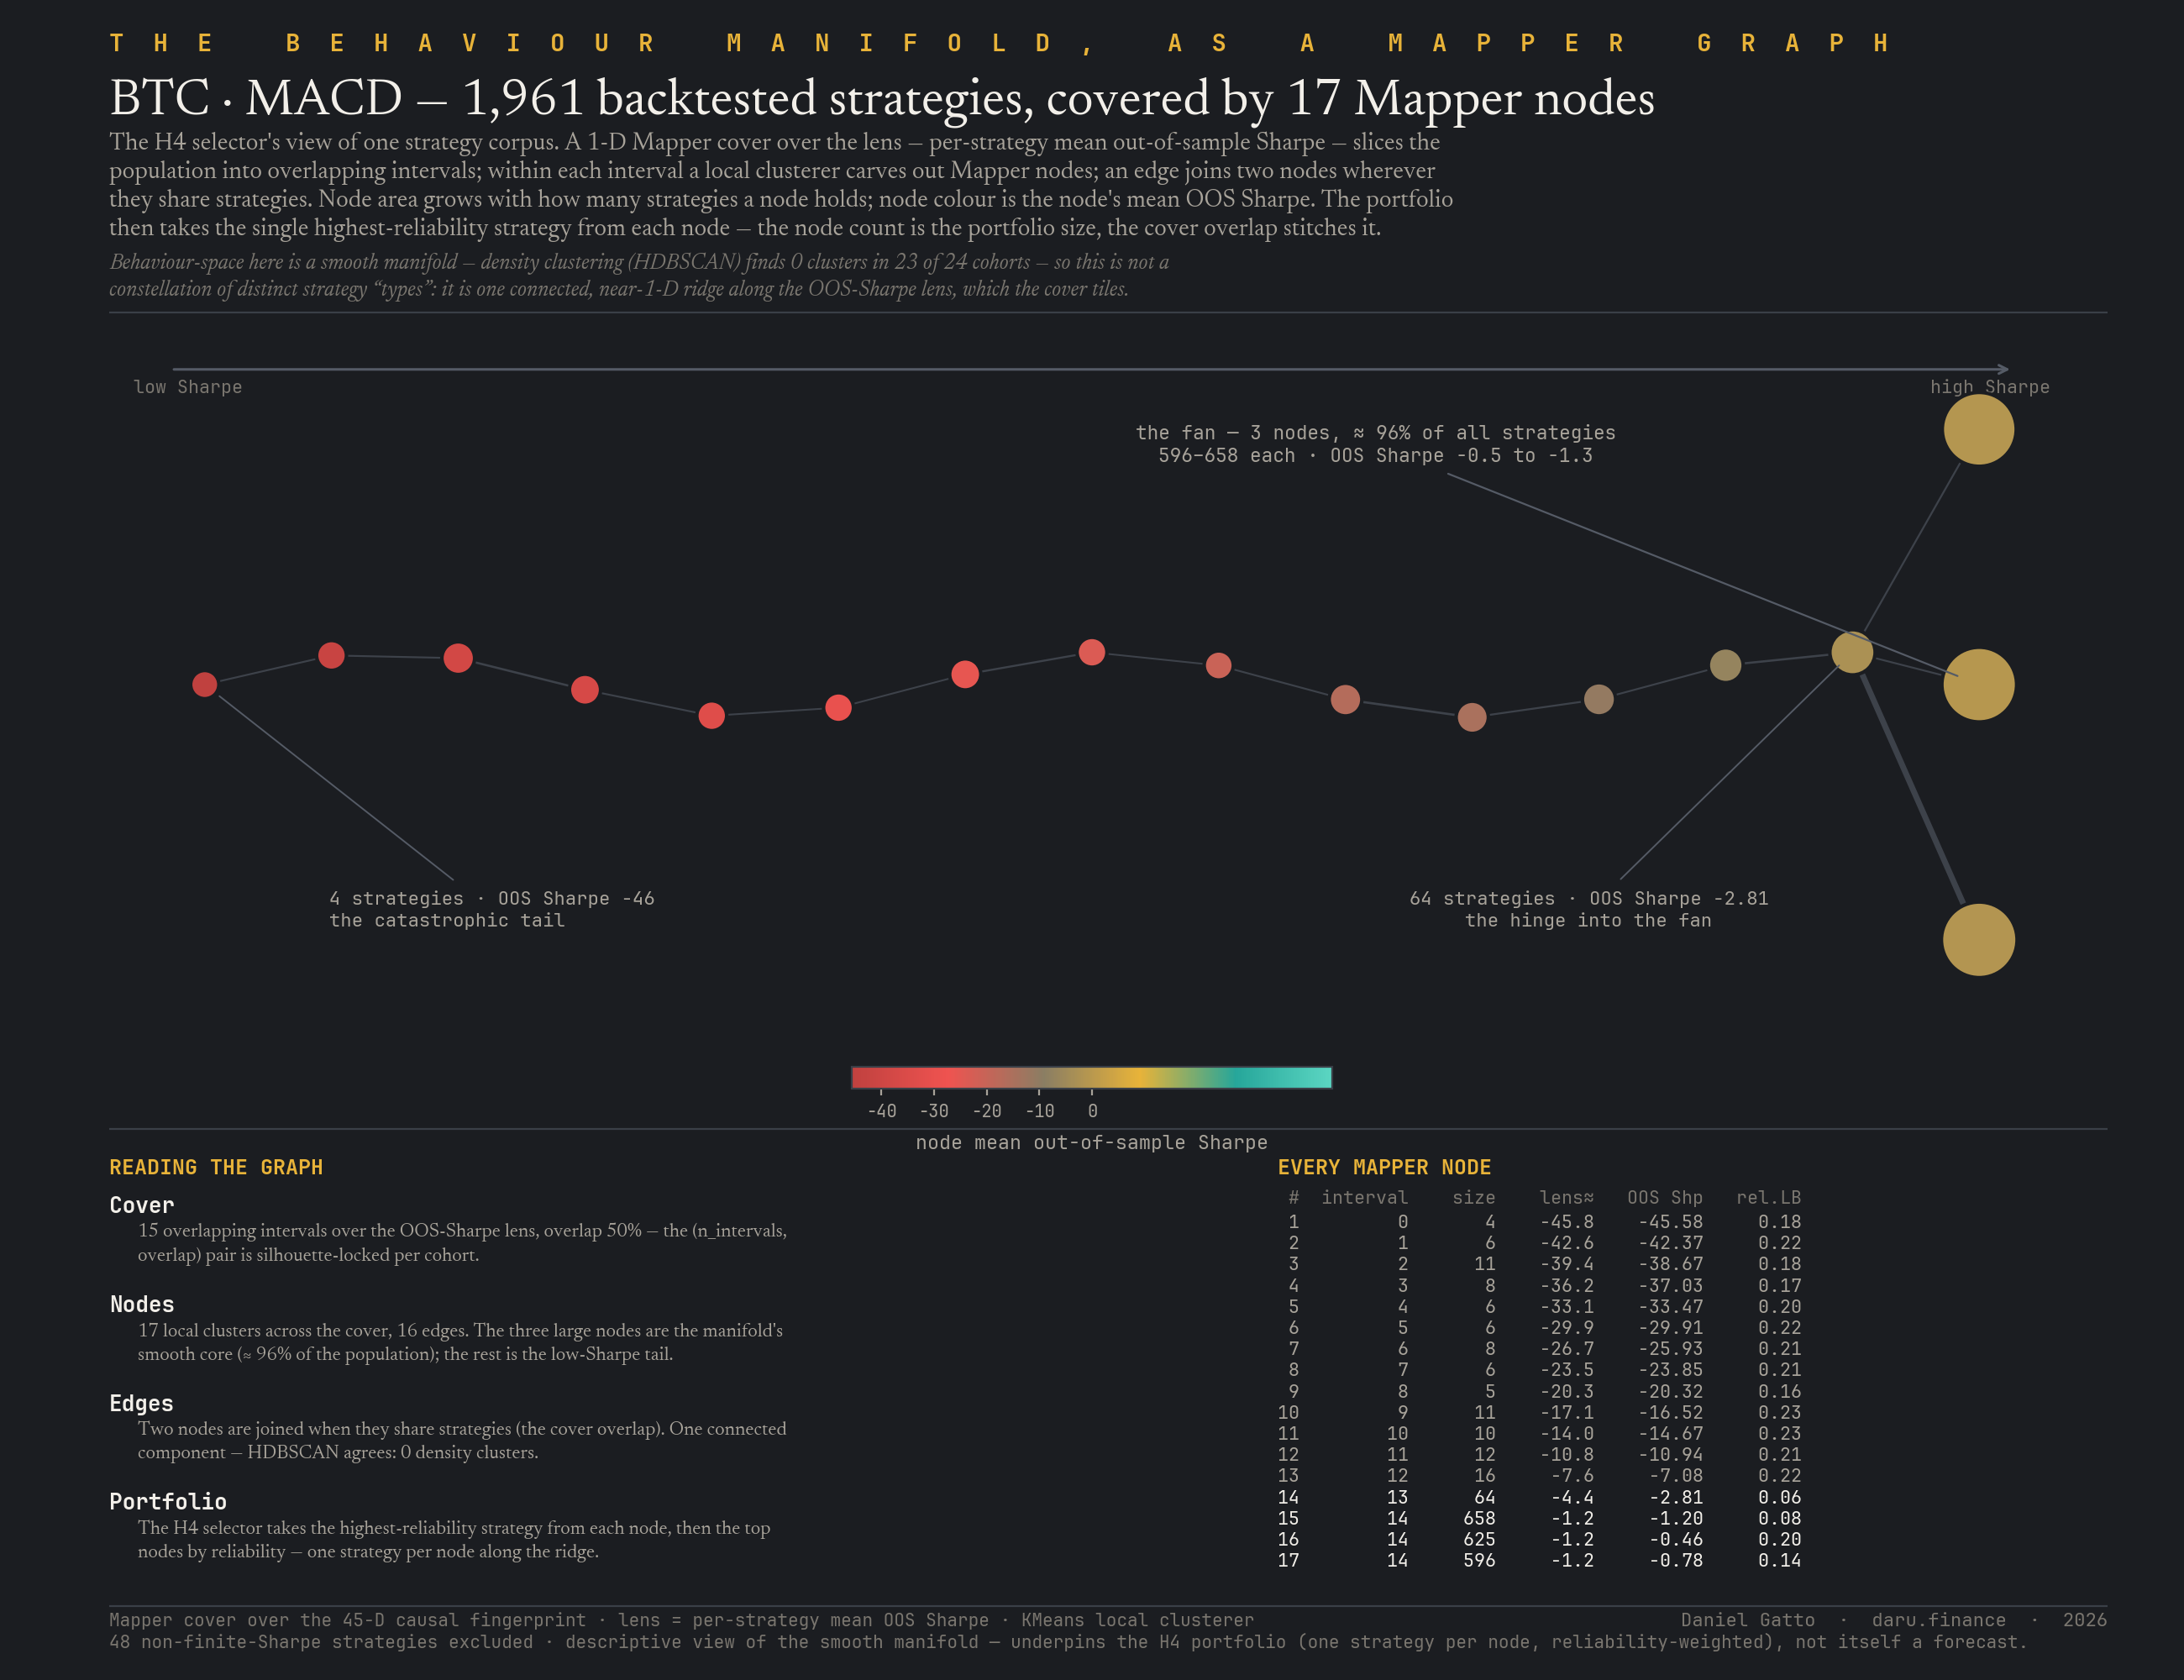
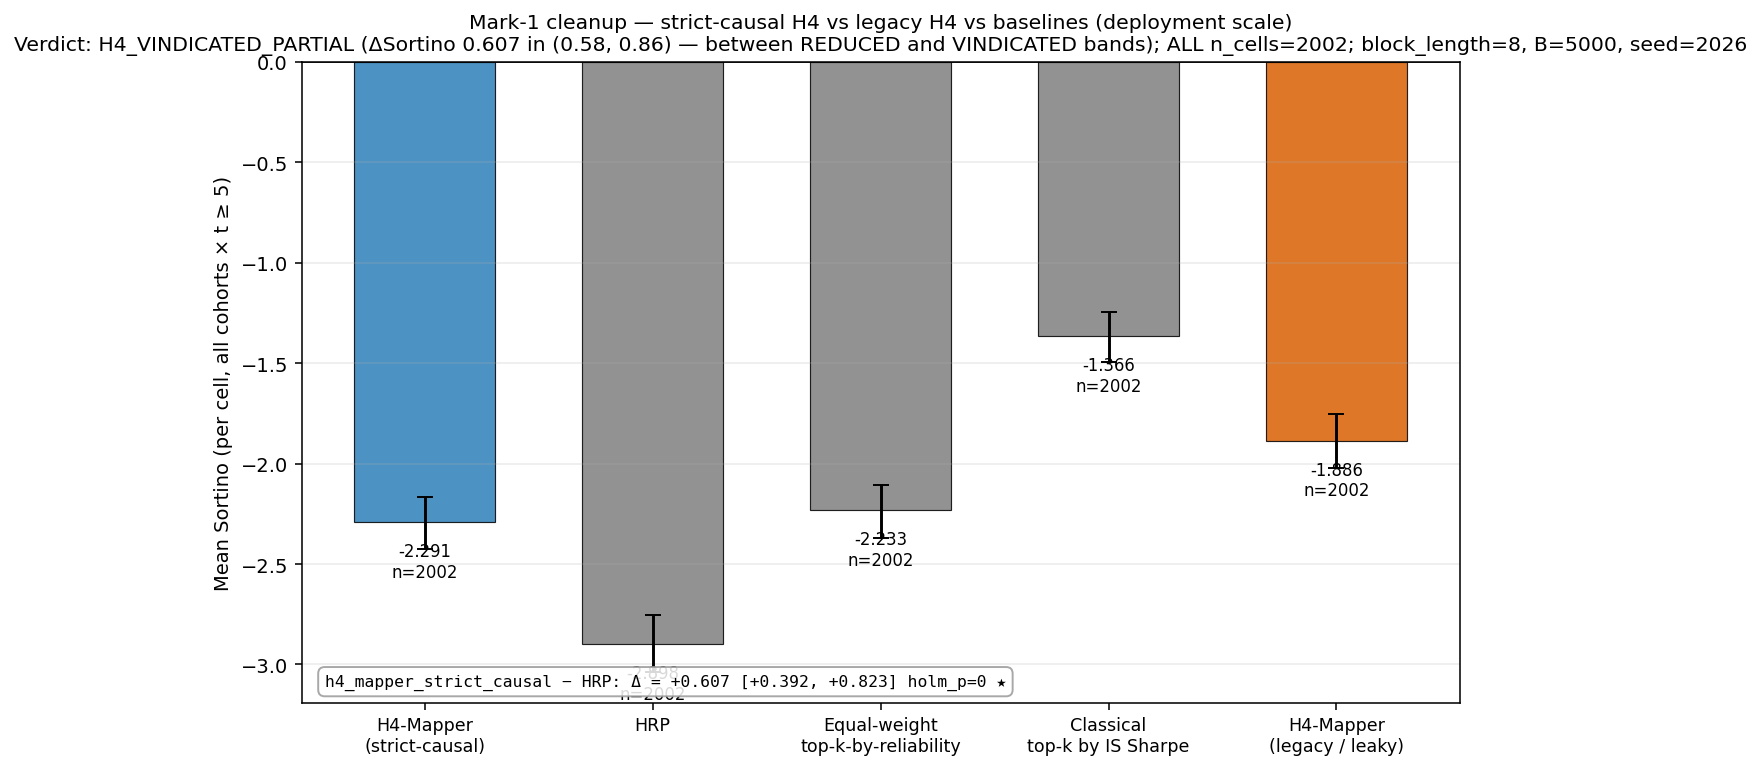
PASSBeats Hierarchical Risk Parity at corpus scale, ΔSortino vs HRP = +0.61 (95% CI [+0.39, +0.82], Holm-significant). The edge is concentrated on the L1-majors cohort (+1.20) and the volatility-and-oscillator indicator families (ATR / MACD / Stochastic %K); on the moving-average families the result is flat or negative. Against a simple top-k-by-reliability equal-weight baseline the Mapper-cluster step is statistically indistinguishable on Sortino, so the topology contribution is coverage and audit-traceability, not raw return, and against a naive in-sample-Sharpe-ranked top-k baseline the topology Stack still loses on Sortino. Honest, audit-traceable construction is what ships.
H17: cohort persistence-trajectory dynamics
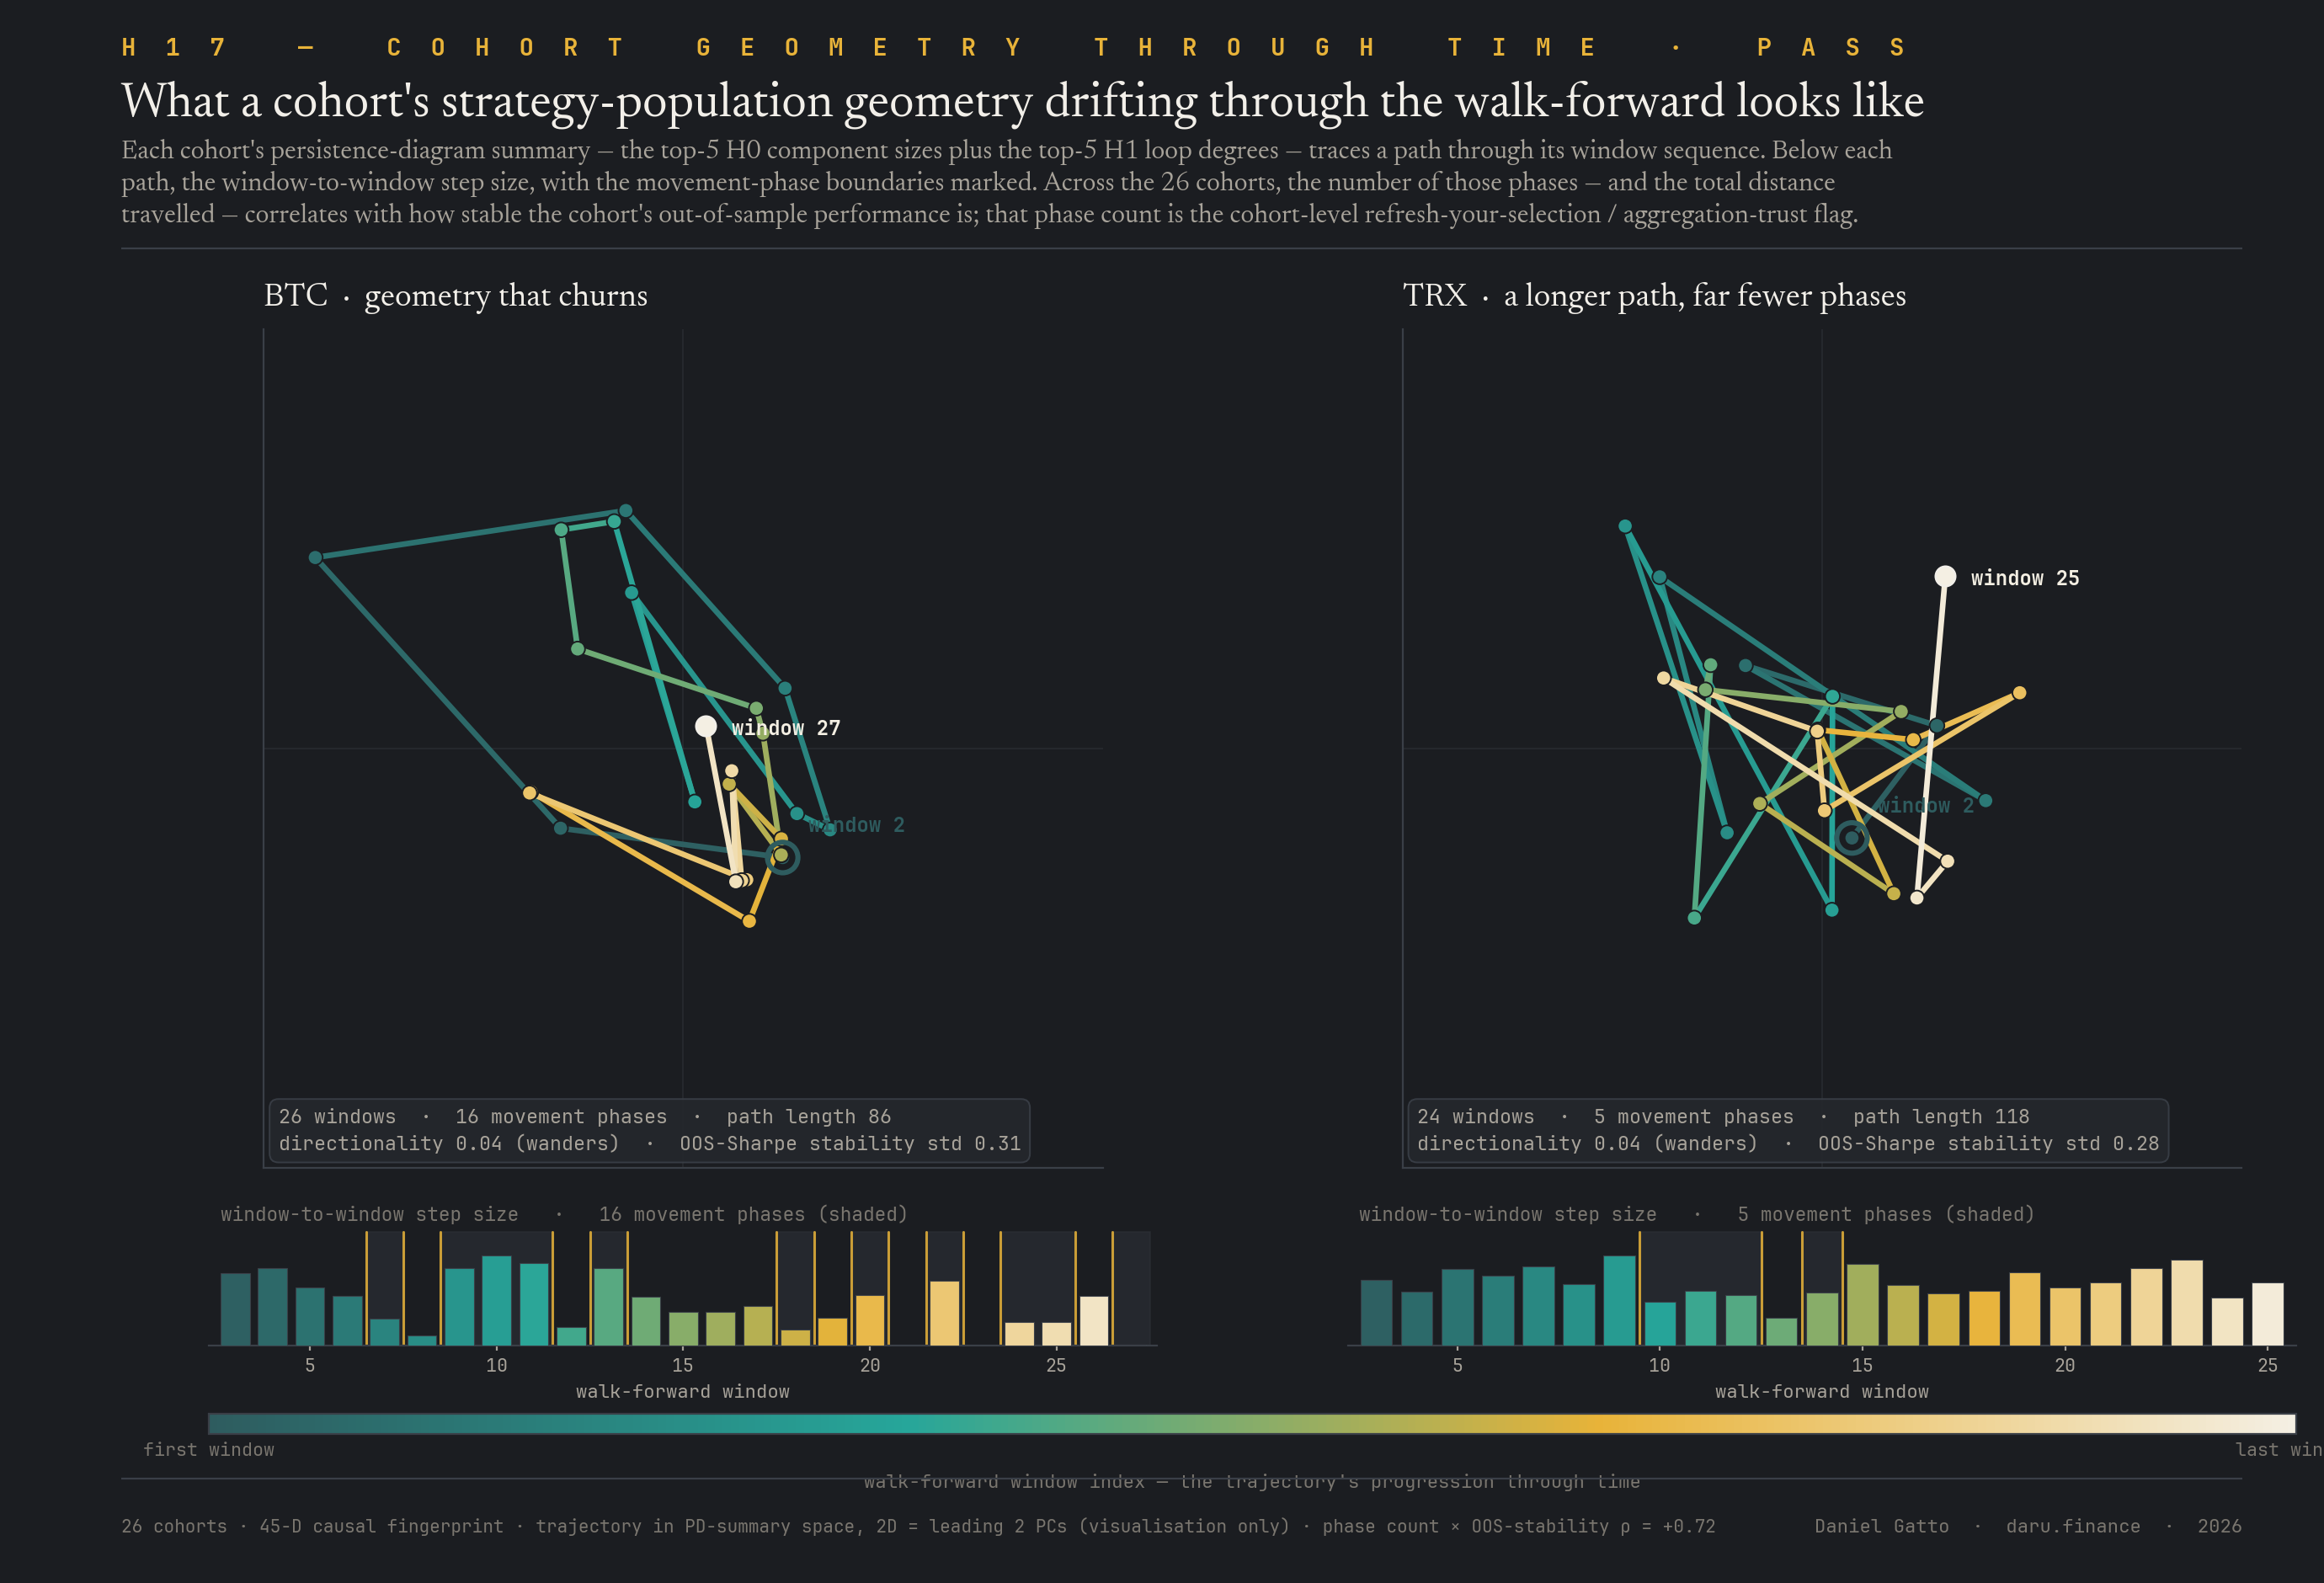
PASSHow a cohort's strategy-population geometry drifts through the walk-forward predicts how stable its out-of-sample performance is (Spearman ρ ≈ +0.72), ships as a cohort-level "trust-this-aggregation" flag.
The Topology Deployment Stack
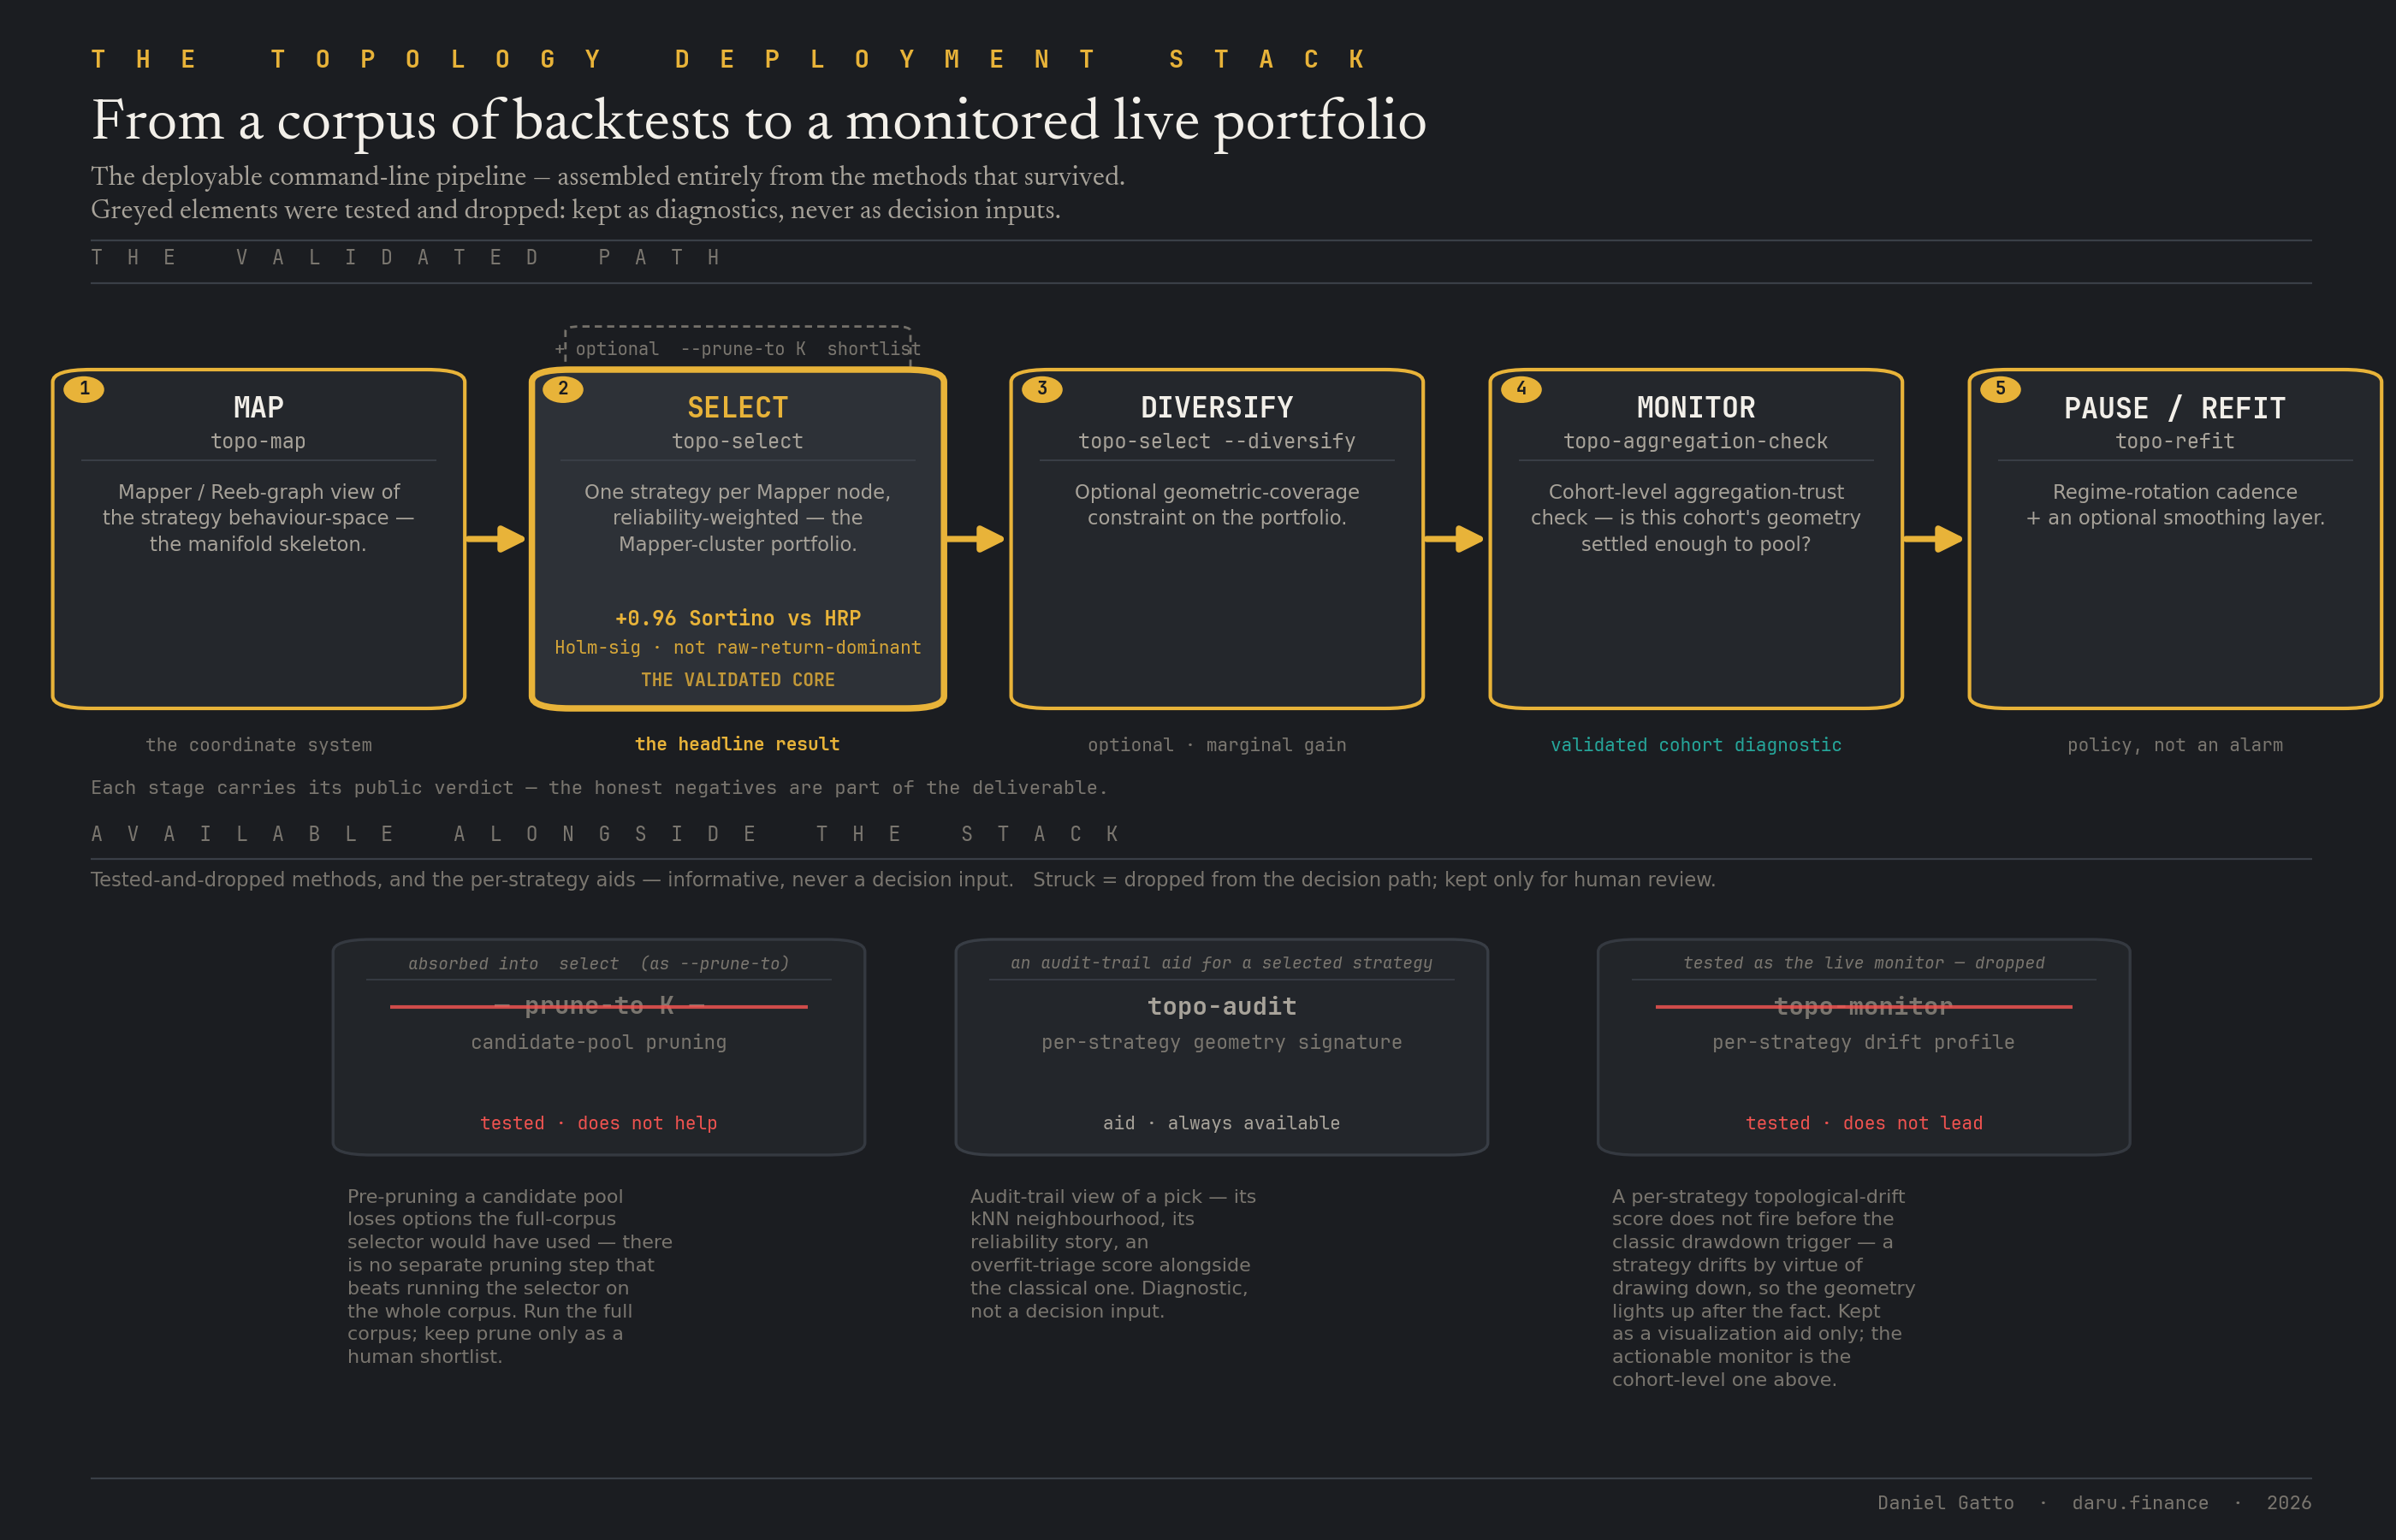
ASSEMBLEDThe trader-facing pipeline, map → select → diversify → monitor → pause/refit, built entirely from the geometric primitives that proved robust, shipped as a ten-command CLI with the negative-result caveats baked into the relevant commands' help text.
Partial: useful, with a ceiling
H12: topological regime detection + cohort rotation
MARGINALThe regime detector itself is null; the cohort-rotation policy that consumes the detected state works. Ships as a paper, not as a regime alarm.
H13: graph-Laplacian smoothing of the neighbour signal
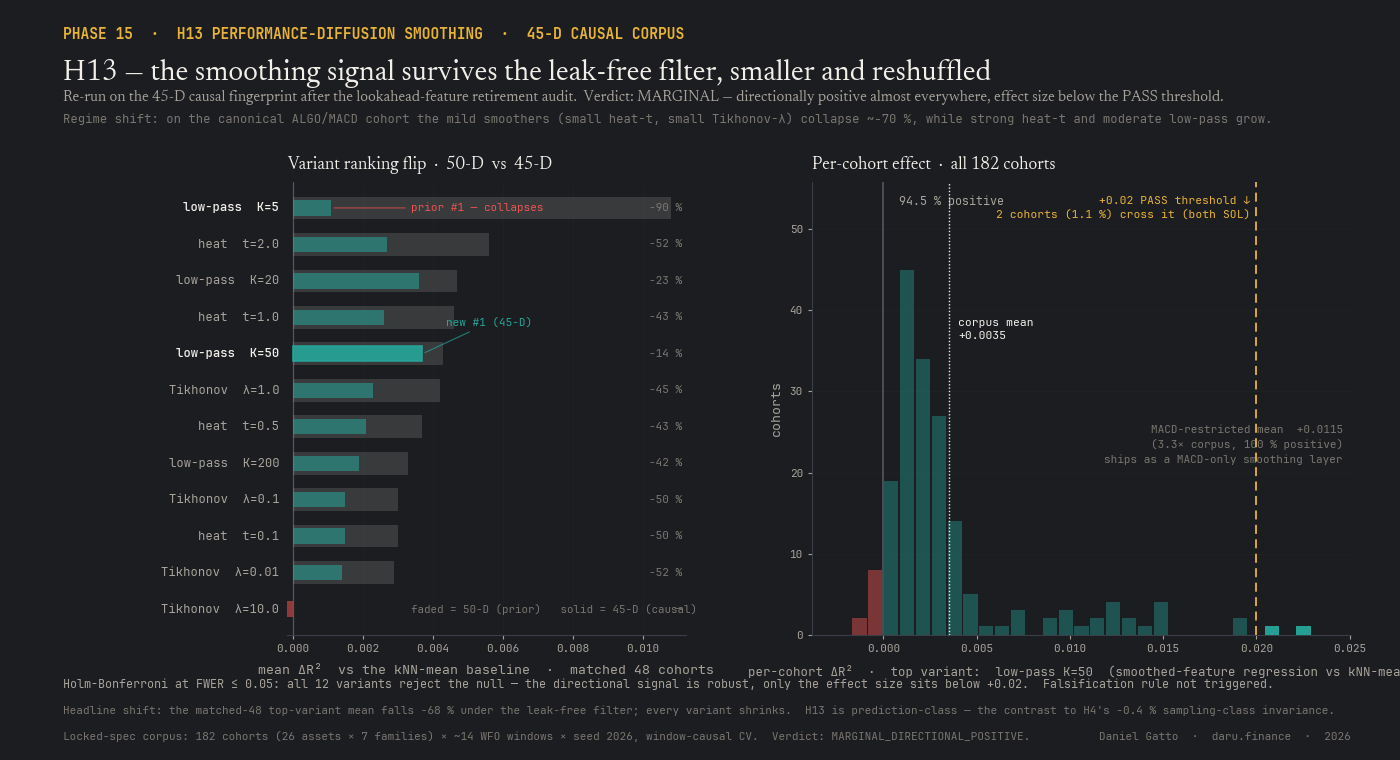
MARGINALDirectionally positive in 94.5% of 182 cohorts but small corpus-wide; ships as an optional moving-average-family smoothing layer, not a corpus-wide win.
H14: geometric-outlier overfit flag
MARGINALA useful triage complement to the classical deflated-Sharpe / PBO diagnostics, strategies flagged by both are the highest-confidence drops, but not a replacement.
H16: geometry-aware coverage portfolios
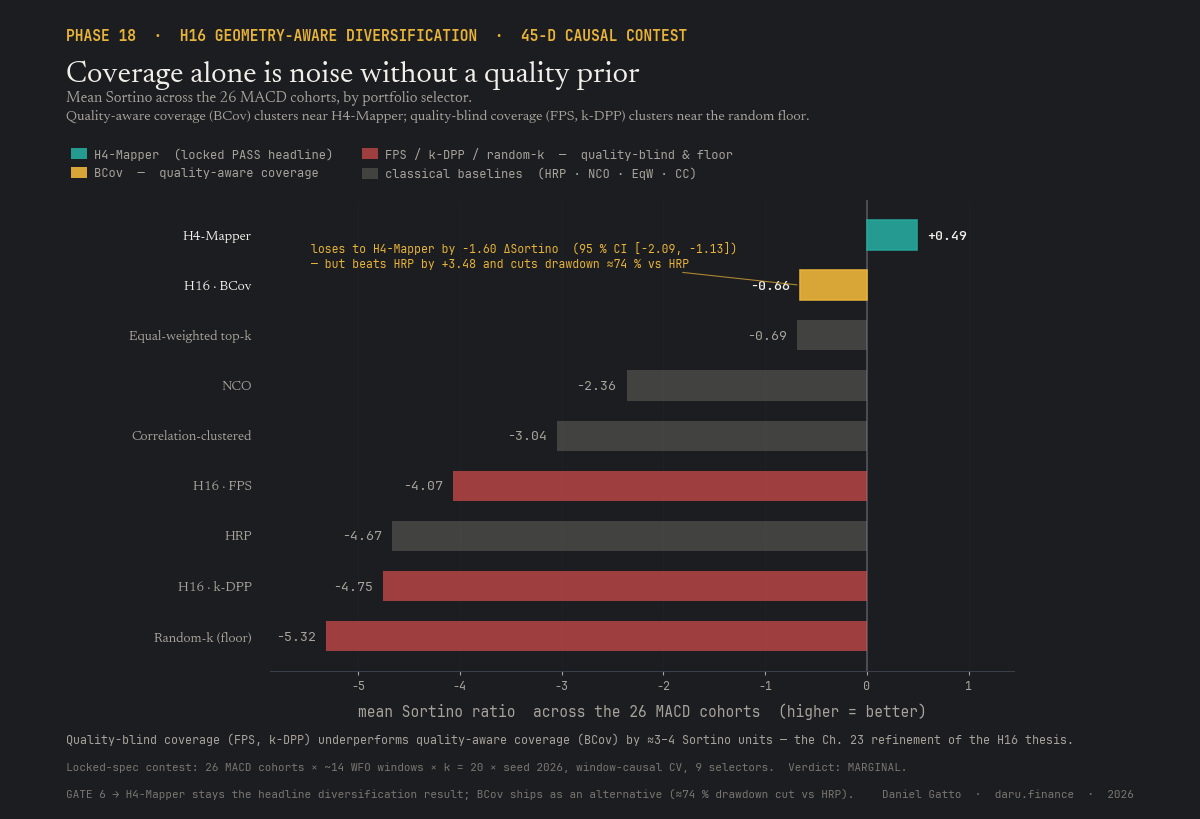
MARGINALNone of farthest-point sampling / k-DPP / Bayesian-coverage beats the Mapper-cluster portfolio, but the contest surfaced the finding that coverage without a quality prior is essentially noise.
What didn't
H3: "topology beats the modern-ML baseline", the make-or-break test
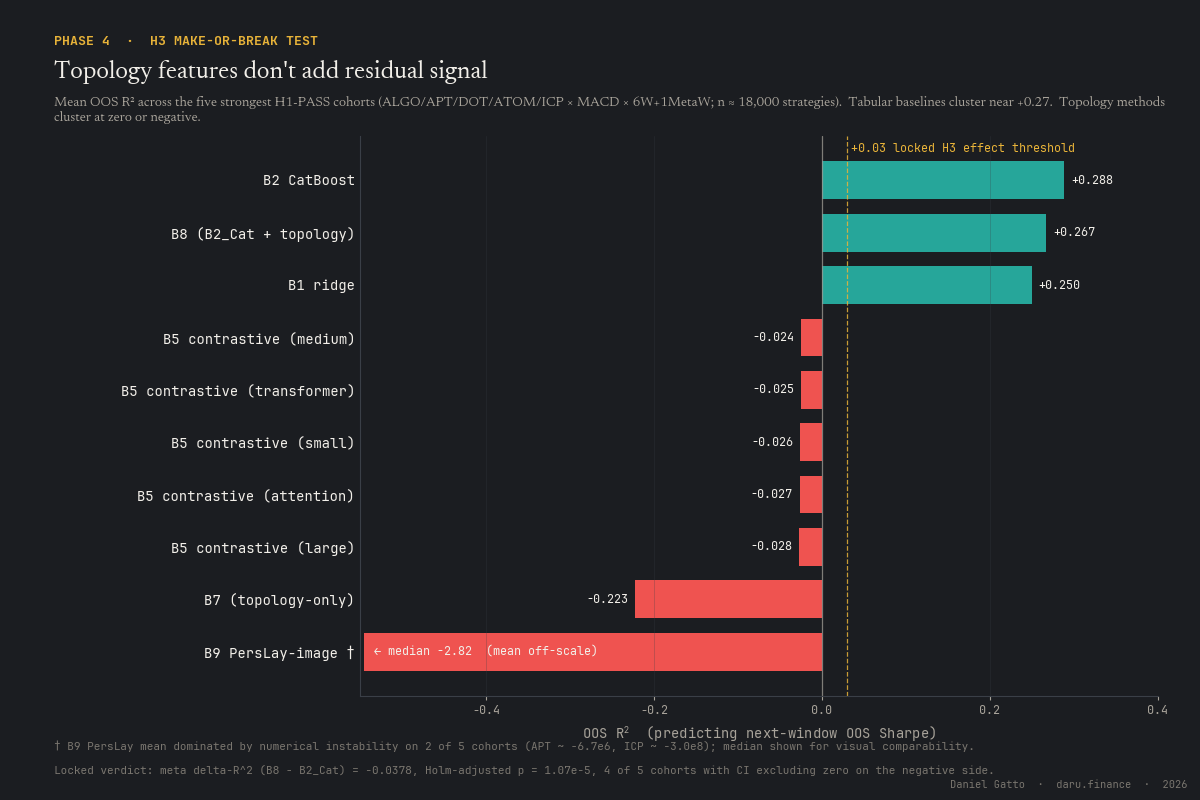
FALSIFIEDPersistent-homology shape-features actively hurt on every one of the five strongest cohorts, across two feature representations and three architecture families. The "topology replaces ML" thesis is dead, the program reframed around what survives.
H2: parameter-space plateau detection
FALSIFIEDBelow the effect threshold across three methods at corpus scale; a behaviour-space salvage looked promising until a window-causal audit showed ~74% of it was look-ahead leakage.
H15: topological hazard / fragility prediction
FAILThe classical ex-ante scorecard already predicts which strategies catastrophically fail (held-out concordance ≈ 0.78 vs ≈ 0.58 for topology), there's no residual for topology to add.
H18: topology-aware candidate-pool pruning
FAILThe selector already exploits the same geometric structure a pruner would, so pre-pruning its input only removes its options. The recommendation: don't pre-prune; feed the selector your full corpus.
H19: per-strategy live-drift monitor
FAILThe drift score fires at the classic drawdown breach, not before it (median lead 0 windows). Ships as a visualisation aid only; the actionable monitor is the cohort-level aggregation-trust check.
H20: portfolio-coverage-health early-warning
FAILThe coverage-health alarm fires at the classic drawdown trigger, not before it (median lead −1.0 windows over co-firing units; 0 of 89 cohorts shows a Holm-significant positive lead). Ships as a descriptive coverage diagnostic only, there is no actionable early-warning signal here.
Failure-mode-diversity portfolio constraint
FAILForcing the portfolio builder to span six failure modes drops risk-adjusted return by a small but Holm-significant amount (−0.09 corpus Sortino, driven by the moving-average-family cohorts). The cost is real but smaller in magnitude than the first-pass measurement suggested. The failure-mode labels themselves are useful as a descriptive portfolio audit; the hard-constraint version is off by default.
H10 / H11, local persistent homology + Fisher–Rao predictive power
DEPRIORITISEDBoth were elaborations of the H3 thesis; with H3 falsified, deprioritised to a follow-up paper. Local persistent homology on a smooth manifold carries nothing.
Phase I is closed, every pre-registered hypothesis has landed a verdict, including H5 (FAIL: no measurable cross-asset universality across L1 majors / alt-L1s / memes / DeFi / L2s, so each crypto cohort needs its own selector, the synthesis chapter rescopes accordingly). Still ahead: synthesis, the eight papers, the applied monograph, the public software package, and a DOI-archived reproducibility container.
18 of 26 phases done across all three phases of the program. Phase I (the pilot) is done, every pre-registered hypothesis has landed a verdict. 3 phases are in flight across the three phases together: Phase II's sheaf-Laplacian aggregation has now landed a partial second-stage refinement on top of its first headline bar (cohomology-gated sheaf-Tikhonov portfolio Holm-dominates the previous headline configuration on three of four pre-registered cuts), and the cost-capacity stability theorem has delivered two complementary operationalizations (a temporally stable discrete-scenario measure with a 16.4% deployable-cost tail, and a continuous basis-point measure that resolves a temporal drift the discrete grid missed; Spearman ρ between them = 0.0491). Theorem, temporal topology, the order-book filter, and the public benchmark are still ahead in Phase II. Phase III, the cross-asset re-run and the synthesis release, is sequenced after.
Codebase
81,873 lines·270 files·as of 2026-05-14
Lines of source across the analysis pipeline, Rust hot loops (parsing, distances, evaluation primitives), Python orchestration and analysis, the production CLI surface, and the figure-render scripts. Not counted: more than 10,000 lines of written verdict reports and methodology notes.
Module breakdown
Fifteen groups across the toolkit, what each one is and roughly how big. Line counts are source only; the per-language bar above is the same total split by language.
- Rust core, parsing, distances, fingerprint, evaluation4,352 lines·6 files
The hot path: the trade-log text parser, the compact binary trades format, the pairwise strategy distances, the strategy fingerprint, and the evaluation primitives, the loops that run over the full corpus, so they live in Rust.
- Rust ↔ Python bindings1,225 lines·1 files
PyO3 bindings that expose the Rust core to the Python side, with parity tests pinning the two implementations to the same numbers.
- I/O layer1,173 lines·3 files
The Python-side trade-log readers, the text parser and the binary trades reader, feeding strategy histories into the rest of the pipeline.
- Strategy-space layer2,016 lines·5 files
Builds the space the whole program studies: the parameter-space embedding, the distance metrics, the behaviour-space embedding, and the window-causal feature builder (the leak-safe version of the fingerprint).
- Topology layer4,133 lines·11 files
Every topological construction used: persistent homology, the regime detector, the persistence-trajectory descriptors, the plateau test, the geometric-outlier / anomaly flags, the Cox-style hazard model, the diffusion smoother, plus the Phase II additions: the strict-causal cluster-nerve construction and the cellular-sheaf / sheaf-Laplacian module behind the Phase II headline portfolio.
- Evaluation layer3,246 lines·10 files
The measurement scaffolding: the walk-forward-optimisation harness, cross-validation, the statistics, the multiple-testing correction, cohort pooling and aggregation, winsorisation, the H2 plateau test, and the bridge to the Rust evaluator.
- Baseline models5,340 lines·18 files
Every comparison the topology features are benchmarked against: XGBoost, LightGBM and CatBoost, TabPFN, ridge, ts2vec, the persistence-image / PersLay / PersFormer / sheaf-network topological learners, the sliced-Wasserstein kernel, Fisher–Rao, contrastive and topo-contrastive encoders, topology-only and topology-augmented heads, and the stacked ensemble.
- Clustering390 lines·2 files
The ToMATo density clusterer used to carve cohorts out of strategy-space.
- CLI apps & package scaffolding5,660 lines·18 files
The practitioner-facing command line, the ten-command Topology Deployment Stack (map, select, portfolio, audit, monitor, refit, aggregation-check, plateau-audit, universality-check, live-adapter) plus the deployment-stack wiring layer that threads them, and the descriptive/audit primitives that sit alongside it: the per-strategy drift profile, the candidate-pool shortlist, the portfolio-coverage-health metrics, and the failure-mode-coverage selector (all four ship with their FAIL verdicts baked into the help text; the coverage-health metrics and the failure-mode selector are kept as descriptive diagnostics, not decision triggers).
- Figure theme176 lines·2 files
The shared plotting theme, colours, fonts, layout defaults, every figure on this page is drawn with.
- Phase driver scripts39,049 lines·104 files
The largest slice: one numbered, re-runnable script per phase and hypothesis, the pilot parse and first light, then H1, H2, H3, the portfolio-meta sweeps, H4, the H12–H20 extensions (H17 trajectory PASS · H13/H14/H16 marginal · H15/H18/H19/H20 FAIL), the failure-mode-diversity constraint test, the full-corpus deployment-scale run, H5 cross-asset universality (FAIL), and the Phase II additions, the strict-causal substrate baselines, the sheaf-Laplacian portfolio sweep behind the topology portfolio-construction work, the friction-sweep scaffolding for the cost-capacity invariant, and the free-data audit for the order-book pilot. Each script is the exact pipeline behind a verdict, not a sketch of it.
- Cloud-burst jobs1,324 lines·9 files
The GPU-burst jobs that run off-box on H100s, data upload, the architecture search, the PersLay top-5 retrain, the Ripser++ parity run, a smoke job, and the sync script that pulls results back.
- Figure-render scripts7,928 lines·31 files
The matplotlib script behind every figure, schematic and diagram here, each one reads the real verdict artefact (or the real run-output parquet, for the behaviour-manifold / Mapper-graph / equity-curve / persistence-trajectory renders) and emits PNG, SVG and PDF, in English and Portuguese where the figure carries text.
- Tests5,993 lines·51 files
Unit tests for the library, Rust ↔ Python parity tests, and end-to-end smoke tests for each CLI app.
- Benchmarks126 lines·1 files
The timing harness that decides what gets pushed down into Rust.
Phased roadmap
17 steps & hypotheses · in sequence · click any node for the detail
- Done
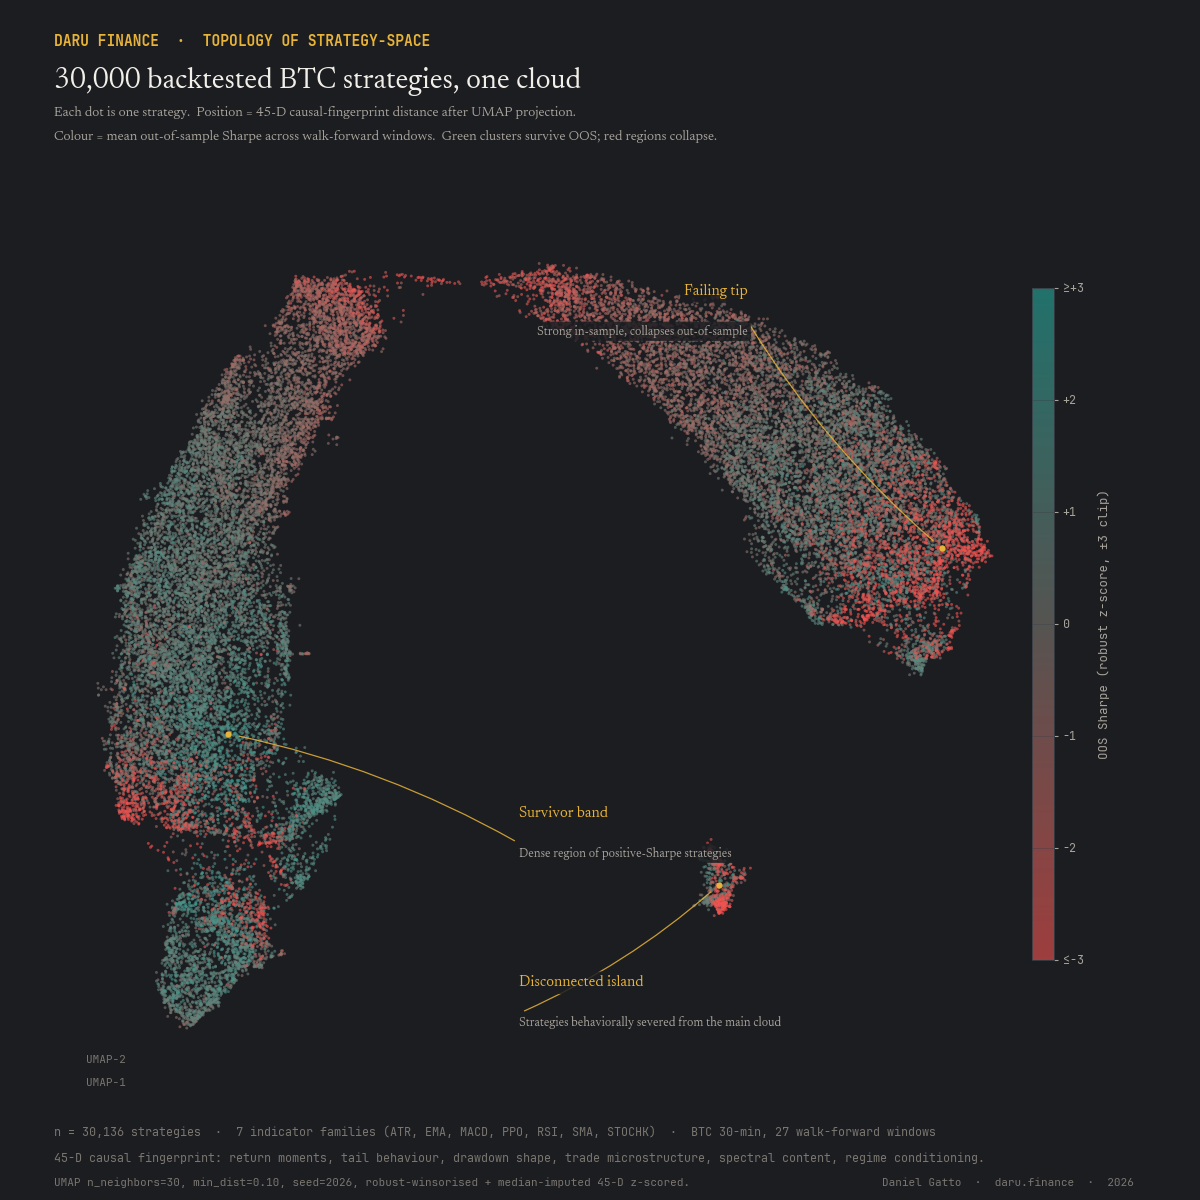
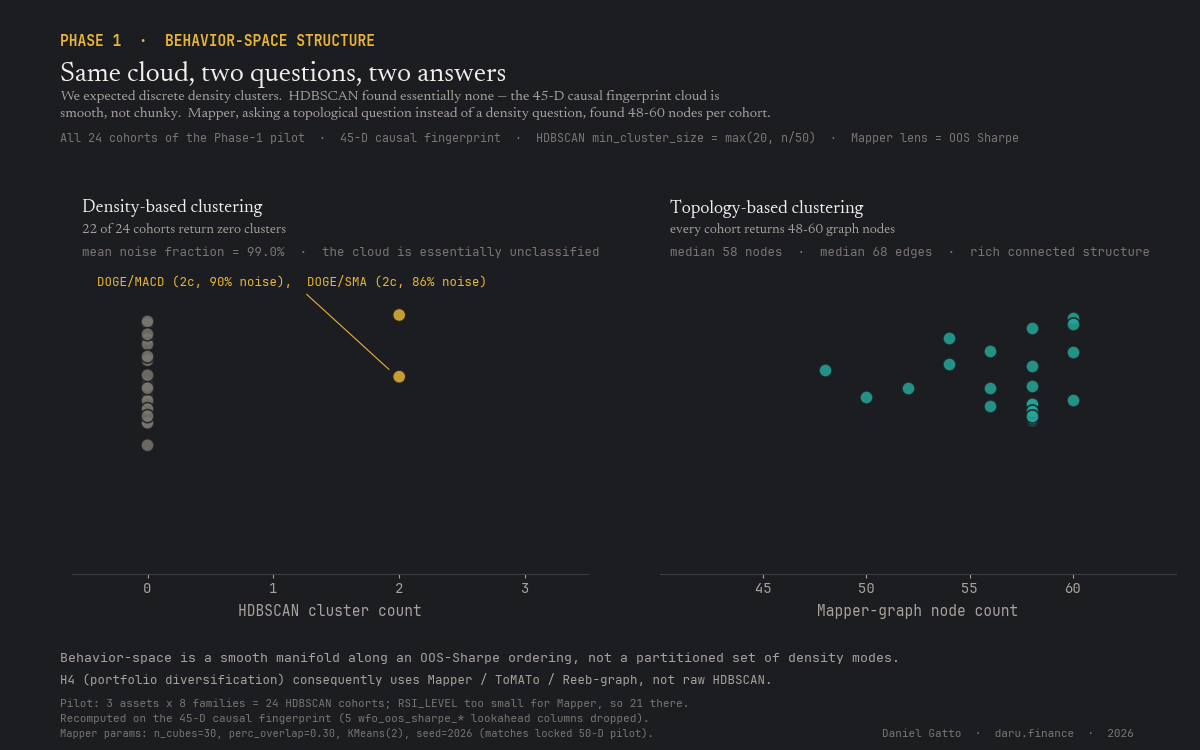
Corpus (~1.4M backtests, 27 assets, 8 indicator families), the 45-D behaviour fingerprint, distance matrices, the 3-asset pilot. Key early finding: the behaviour-space manifold is smooth, not chunky, which set the H4 method (Mapper, not HDBSCAN).
- Done
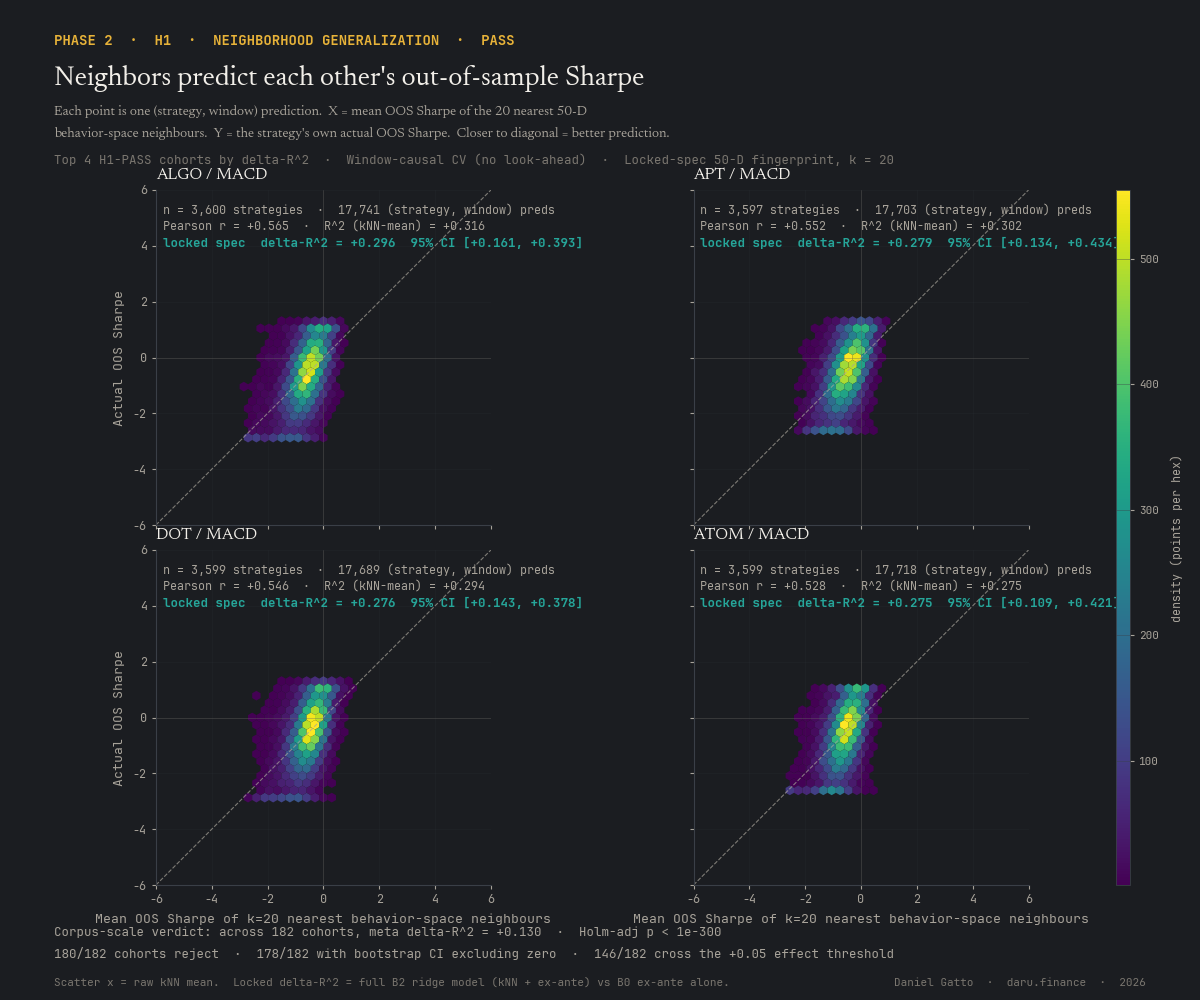
Do a strategy's behaviour-space neighbours predict its future? Yes, the mean OOS Sharpe of the 20 nearest neighbours predicts the strategy's own next-window Sharpe far better than its own past does. Meta ΔR² = +0.130 across 182 cohorts. PASS, the foundation everything downstream rests on.
- Done
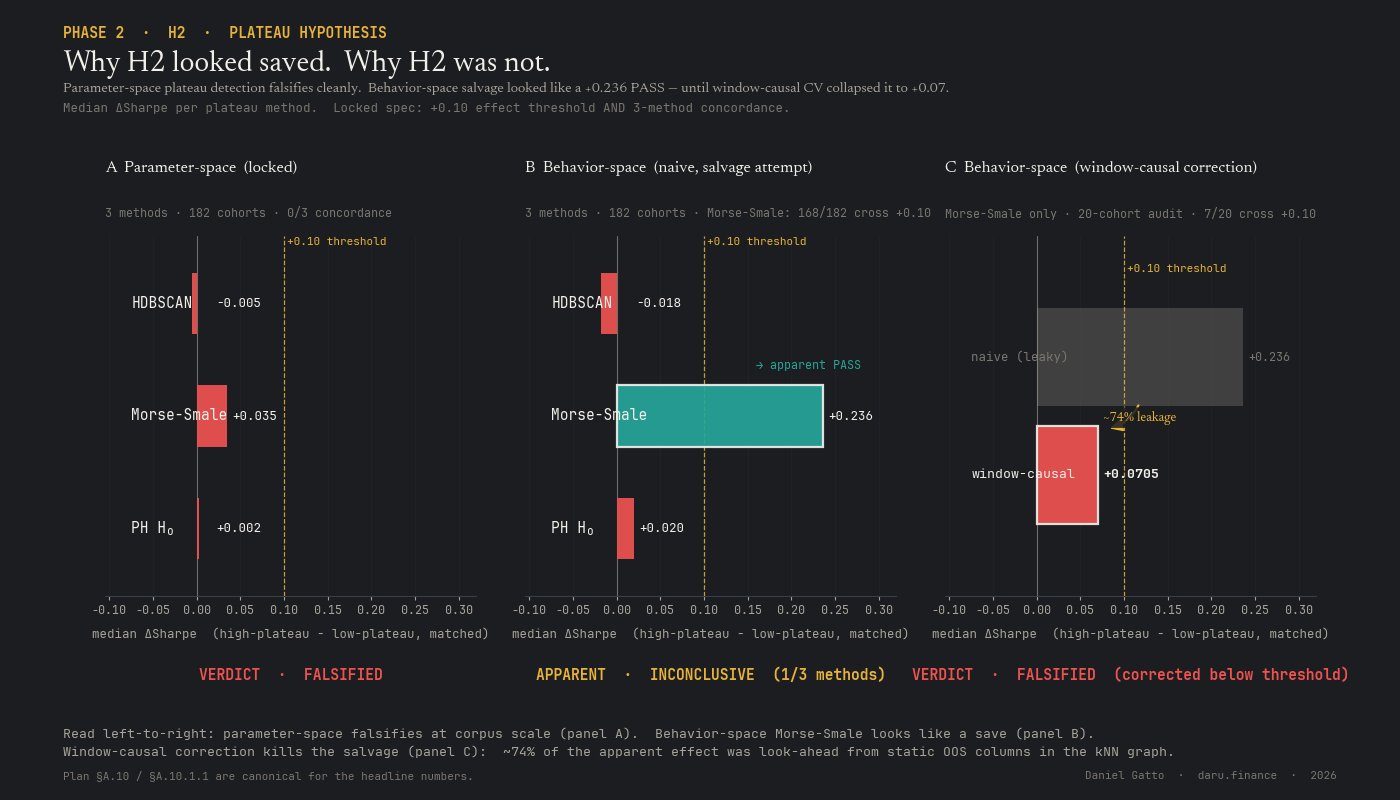
Do strategies on broad parameter plateaus generalise better than ones on sharp peaks? No, three plateau measures, all below threshold. A behaviour-space salvage looked promising (+0.236) until a window-causal audit showed ~74% was look-ahead leakage. Falsified, and the leakage trap is now guarded against everywhere.
- Done
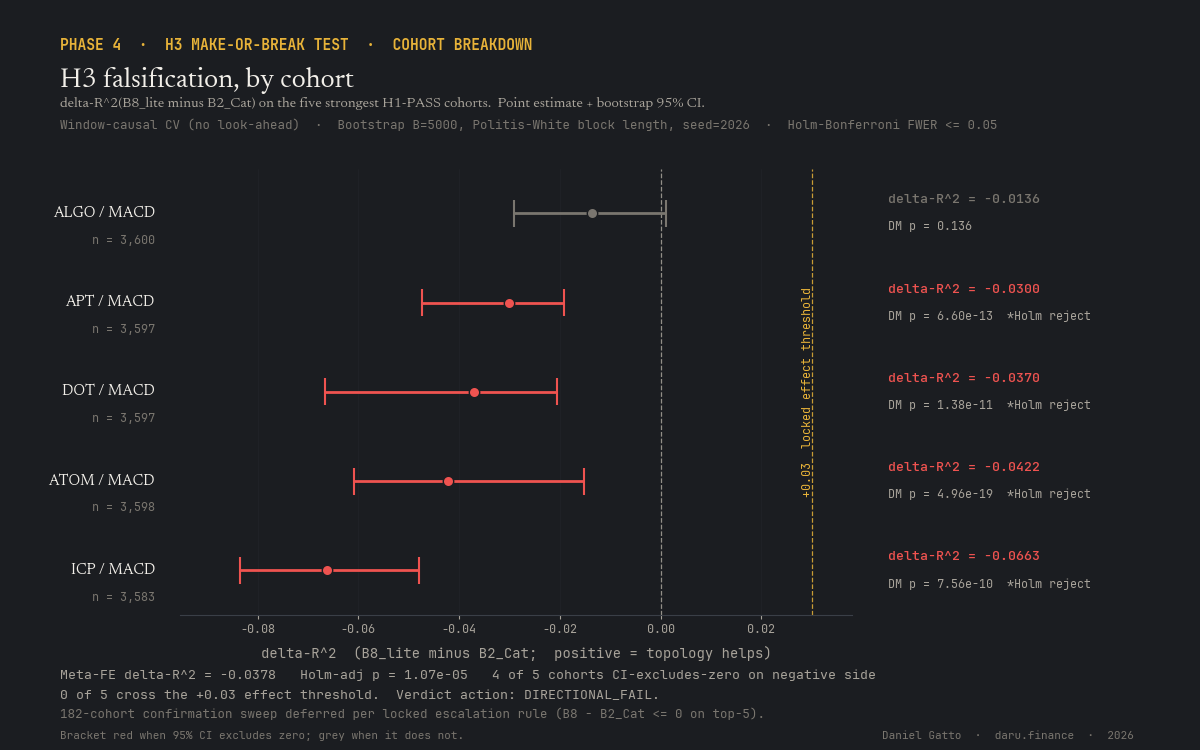
The central test: do persistent-homology shape-features beat the strong modern-ML baseline at predicting OOS performance? No, they actively hurt on every one of the 5 strongest cohorts (meta ΔR² = −0.038, p = 1.07×10⁻⁵), across 2 feature representations and 3 architecture families. Falsified. The 'topology beats ML' claim is dead, the program reframes around what survives.
- Done
A program-wide methodology gate before the H4 portfolio work: the predictor-input feature set was reviewed and locked, the per-window-causal evaluation discipline was tightened across every hypothesis, and a two-class split surfaced, methods that use topology to describe the strategy universe are robust to the discipline change, methods that use topology to forecast individual strategy performance shrink under it. The seed of the program's central methodological finding.
- Done
Build a portfolio by sampling one strategy per Mapper cluster, weighted by each strategy's Beta-Binomial reliability lower-bound. At deployment scale, every crypto asset × indicator family × walk-forward window, the topology Stack beats Hierarchical Risk Parity by +0.61 ΔSortino (95% CI [+0.39, +0.82], Holm-significant), concentrated on the L1-majors cohort and the volatility-and-oscillator indicator families. Against a simple top-k-by-reliability equal-weight baseline the Mapper-cluster step is statistically indistinguishable on Sortino, so the topology contribution is coverage and audit-traceability, not raw return, and against the naive in-sample-Sharpe-ranked top-k baseline the topology Stack still loses on Sortino. Risk-parity-beating, honest, audit-traceable construction is what ships.
- Done
Can TDA flag market regime changes earlier than the standard HMM, and does that help rotate strategy cohorts? The topological regime detector is null; the cohort-rotation policy that consumes the detected state works. MARGINAL, ships as Paper F.
- Done
Does graph-Laplacian smoothing of the H1 neighbourhood signal extract more than naive averaging? Directionally positive in 94.5% of 182 cohorts but small (corpus mean +0.0035 ΔR²; MACD-restricted +0.0115). MARGINAL, ships as an optional MACD-only smoothing layer.
- Done
Is a geometric anomaly score a better overfit detector than the classical deflated-Sharpe / PBO diagnostics? It's a useful triage complement (strategies flagged by both are the highest-confidence drops), not a replacement. MARGINAL.
- Done
Do explicit geometric-coverage portfolios (farthest-point sampling, k-DPP, Bayesian-coverage) beat the H4-Mapper portfolio? No, but they surface the chapter finding: quality-aware coverage works, quality-blind coverage is near random-portfolio noise. MARGINAL, H4 stays the headline diversifier.
- Done
Does the way a cohort's persistence diagram moves through walk-forward windows predict how stable its OOS Sharpe is? Yes, trajectory-segment count × stability Spearman ρ = +0.72. PASS, ships as a cohort-level 'trust-this-aggregation' diagnostic.
- Done
Can topology predict which strategies will catastrophically fail, even though it can't predict the level of OOS Sharpe? No, reliably worse than the classical features (held-out C-index ≈ 0.58 vs 0.78). FAIL, the failure event has a sharp signature the standard scorecard already captures.
- Done
Is a geometric-outlier filter a better way to cut 30,000 backtests to a manageable shortlist than a deflated-Sharpe / PBO filter? No, the H4 selector against the full corpus beats any 100-shortlist. FAIL, don't pre-prune; the Deployment Stack's prune stage collapses into select.
- Done
The central methodological finding, validated across every hypothesis and refined four times: topology helps when you use it to describe your strategy universe and decide over its shape, and only when it adds a degree of freedom the standard approach lacks, and that degree of freedom has to be predictive of the outcome; it doesn't help when you use it to predict an individual strategy. Captured by a new paper, Paper H.
- Done
Is the behaviour-space topology similar enough across structurally-similar crypto assets (L1 majors / alt-L1s / memes / DeFi / L2s) to justify pooling a topological selector across them? No, bottleneck within-cohort / cross-cohort ratio 1.018 (p = 0.59); Gromov–Wasserstein 0.96 (p = 0.24). FAIL, each asset needs its own selector; do not pool cohorts.
- Done
Does the distance of a live strategy's running behaviour fingerprint from its origin cluster predict an imminent edge collapse, early enough to act? No, the per-strategy drift score is coincident-to-lagging, not leading: it fires at the classic drawdown breach, never before. FAIL. Kept as a visualization aid only; the actionable monitor is the cohort-level 'trust-this-aggregation' check. It added the fourth refinement of the central finding, an added degree of freedom isn't enough either; it has to be predictive of the outcome, and a 'drift' signal carries no information about future drawdown.
- Done
The trader-facing pipeline a practitioner runs on their own corpus: map → select → diversify → monitor → pause/refit, built entirely from the robust geometric-outlier primitives. Assembled, a ten-command CLI (map, select, portfolio, audit, monitor, refit, aggregation-check, plateau-audit, universality-check, live-adapter), with the FAIL-derived caveats baked into every relevant command's help text. H18 and H19 both done (the prune stage collapsed into select; no per-strategy drift trigger, the cohort check is the monitor). A worked end-to-end example on a fresh cohort, the runbook / live-deployment / case-study chapters drafted, and the external user-test package ready to dispatch.
Status as of 2026-05-14, Phase I (the pilot) is done. H1 PASS · H2 & H3 falsified · H4 PASS at corpus scale (ΔSortino vs HRP = +0.61, Holm-significant, concentrated on L1-majors and the volatility-and-oscillator indicator families; statistically indistinguishable from a simple top-k-by-reliability equal-weight baseline on Sortino, so the topology contribution is coverage and audit-traceability rather than raw return) · H5 FAIL (no measurable cross-asset universality, each crypto cohort needs its own selector) · the six H12–H17 extensions: H17 PASS, four marginal, H15 fail · H18 fail · H19 fail · H20 fail · the failure-mode-diversity constraint fail (smaller in magnitude than first measured but still a net cost on risk-adjusted return) · the prediction-vs-decision partition · the Topology Deployment Stack assembled. Phase II, the multi-month research program, and Phase III, the cross-asset re-run and the synthesis release, have their own roadmaps below.
Phase II · multi-month research program
Where it goes next
7 work packages · sequenced theory-first · click any node for the detail
The first phase established the program's central methodological finding, the prediction-vs-decision partition, and shipped a deployable toolkit on top of it. The next phase turns that finding into a theorem, builds finance-native topological constructions that the pilot's generic objects could not, and adds an execution-risk data layer the first phase never touched. Seven work packages, sequenced theory-first.
- Done
Locked second-round pre-registration. Stricter window-causal substrate for the strategy-cluster construction. Baselines re-confirmed under the new substrate, with the rank-by-historical-Sharpe top-20 ranker as the bar to beat.
- Planned
Turn the program's central methodological finding, topology earns its place on decision-side tasks, not prediction-side ones, into a precise theorem, with a pre-registered falsification attempt designed to break it (topological autoencoders, RTD, differentiable persistence, local-witness PersLay on the existing corpus). A clean negative confirms; a positive is itself a major result.
- In progress
A new invariant, the friction level at which the giant profitable region of strategy-space dies, under cost, capital, and holding-period filtrations. Two complementary operationalizations have now landed: a discrete-scenario measure on the existing 5-scenario perturbation panel (baseline / fee / slippage / entry-drift / entry+indicator) that is temporally stable per strategy and has a 16.4% deployable-cost tail (the strategies that survive the entire envelope); and a continuous basis-point measure on a 9-point absolute-cost grid where the deployable tail shrinks to 0.34% and a Holm-rejected temporal drift appears at fine resolution that the discrete grid missed. Spearman ρ between the two measures = 0.0491, they capture genuinely complementary axes of cost-fragility, not coarsenings of the same scalar. Bottleneck-stability theorem on the invariant and the (cost × walk-forward-time) bifiltration's slope as a 'this edge is being crowded out' signal are next.
- In progress
A cellular sheaf on the strategy-cluster nerve. Its first cohomology characterises exactly when clustering is information-lossless. The induced sheaf-Laplacian gives a partition-based portfolio that interpolates between rank-by-reliability and the cluster-aware diversifier, first headline result cleared the pre-registered bar (+0.72 ΔSortino over a naive in-sample-Sharpe-ranked top-20 baseline, Holm-rejected on the corpus; EMA +0.59, SMA +1.15, both Holm-rejected; 6 of 7 families individually significant, see the related article 'A topological way to build portfolios'). Mid-sprint: a first-cohomology-gated sheaf-Tikhonov-regularised variant Holm-rejects that earlier headline configuration on the ALL grouping (+0.20), on the EMA family (+0.53), and on the MACD family (+0.65), and Holm-dominates three further baselines; it misses the SMA family (−0.10, not Holm-rejected), so the pre-registered "must clear both moving-average families" bar is half-met, with a clean Stage 2 path (full λ-cross-validation, threshold tuning, per-member theory stalk) to potentially close the SMA gap. The same workpackage also confirmed that the first-cohomology obstruction is decoupled from per-cell decision quality (Spearman ρ = −0.035; threshold ρ ≥ 0.40 not approached) and that restricting the partition to a recent 8-window cover reduces the obstruction with large Holm-rejected effect sizes on both selection metrics tested, both empirical legs of the prediction-vs-decision theorem at the methodology level.
- Planned
Zigzag persistence and CROCKER stacks on the strategy population across walk-forward windows. Does population-level topological reorganisation lead regime breaks before per-strategy drift does? Reported either way; a zigzag-stability filter on the cluster-aware portfolio is the decision-side payoff.
- Planned
Persistent homology of the crypto limit-order book, depth-sublevel sets, (price, depth) point clouds, post-trade resilience zigzags, instrumented on the existing backtest's trade timestamps and used as an execution filter that down-sizes signals when the book is topologically unstable. Free-data pilot first; paid feeds only on positive signal.
- Planned
Release the corpus, the behaviour fingerprint, the walk-forward protocol, and two canonical tasks (out-of-sample-Sharpe prediction vs the strong tabular baseline; portfolio construction vs the rank-by-historical-Sharpe top-20) as a public benchmark with a leaderboard, alongside a monograph synthesising the program's positives and its honest negatives.
Status as of 2026-05-14, re-foundation done (stricter window-causal substrate locked, second-round pre-registration in place, baselines re-confirmed). Sheaf-Laplacian aggregation has cleared its first pre-registered statistical bar (+0.72 ΔSortino over a naive in-sample-Sharpe-ranked top-20 baseline; Holm-rejected on the corpus, biggest margins on EMA +0.59 and SMA +1.15; 6 of 7 families individually significant, see the related article 'A topological way to build portfolios'). Mid-sprint: a cohomology-gated sheaf-Tikhonov-regularised portfolio Holm-rejects that earlier headline configuration on the ALL grouping (+0.20 ΔSortino), on the EMA family (+0.53), and on the MACD family (+0.65), and Holm-dominates three further baselines (strict-causal H4 +1.29; naive Sharpe-rank top-20 +0.92; equal-weight reliability +1.23); it misses the SMA family (−0.10, not Holm-rejected), so the pre-registered "must clear both moving-average families" bar is half-met, with a clean Stage 2 follow-up path. The cost-capacity stability theorem has shipped two complementary measures (a temporally stable discrete-scenario cost class with a 16.4% deployable-cost tail; a continuous basis-point measure that resolves a Holm-rejected temporal drift the discrete grid missed; Spearman ρ between them = 0.0491, the two measures are essentially uncorrelated and answer different deployment questions). Theorem, temporal topology, order-book filter, and the public benchmark are still planned.
Phase III · cross-asset replication & release
After that, cross-asset re-run, then release
Re-run the full pipeline on FX majors and an equity universe, then ship the synthesis, eight papers, the applied monograph, the long-form survey article, and the public software package. Future scope, sequenced after Phase II's headline papers are out.
- In progress
Re-run the full crypto pipeline on FX majors and on an equity universe. The hypothesis: the program's central methodological finding (prediction-vs-decision) and its two headline decision-side methods (cost-capacity, sheaf-Laplacian aggregation) hold cross-asset. The audit: report the failure modes honestly, instruments with different microstructure (FX intraday seasonality, equity dividend events, regulated trading hours) are the natural break points and the points worth reporting on either way.
- Planned
Eight papers (including the prediction-vs-decision-partition methodology paper), the applied monograph, the Topology Deployment Stack software package, the long-form survey article on this site, and a DOI-archived reproducibility container. External user-test on 1–2 practitioners outside the project before public release.
Not yet started · scope locks when Phase II's headline papers are out · the cross-asset re-run gates the synthesis chapter.
Phase 01 · Finished · 2026-05-09 (Day 1)
Foundations & pilot
Completed 2026-05-09, Day 1 of the program
The corpus is ~1.4M backtested strategies across 27 crypto assets, 8 indicator families, and 6–30 walk-forward windows per asset. Phase 1 built the unified parquet, the 50-feature behavior fingerprint per strategy, the per-family parameter parser, the streaming `trades.bin` decoder (242M trade rows in 17 minutes), and the distance-matrix infrastructure that scales to 1M+ strategies via Faiss IVF-PQ.
Subphases that landed under Phase 01: (a) bootstrap the public repo + Docker container + CI; (b) parser end-to-end on 100 .txt files; (c) parsed-only 42-D fingerprint + full 50-D fingerprint; (d) distance matrices and the kNN search; (e) Mapper-of-strategies first pass + HDBSCAN first pass.
First-light findings on 3 pilot assets (BTC, DOGE, AVAX, 127,879 strategies, 24.8M long-form rows, 13 minutes of wall-time): the kNN-aggregate predicts OOS Sharpe with mean Pearson 0.94 and Spearman 0.37 on the pilot, top-H₀ persistence is uniform 6.0–7.1 z-units across cohorts, top-H₁ persistence (0.47–1.46) discriminates indicator families, and HDBSCAN finds zero clusters in 23 of 24 cohorts at locked parameters. The behavior-space manifold is smooth, not partitioned, which changed the H4 method choice from raw HDBSCAN to Mapper / ToMATo / Reeb-graph at lock-in.
- Falsifiability is non-negotiable. Every empirical chapter has a pre-registered falsification criterion locked at end-of-Phase-1.
- Phase gate cleared: the pre-registration manifest is immutable from 2026-05-09 forward; subsequent revisions live in a v2 sibling document.
- All Phase-1 outputs reproducible bit-for-bit from the locked seed = 2026 and the committed Docker image.
Phase 02 · Finished · 2026-05-09 (Day 1)
Geometric analysis, H1 PASS, H2 FALSIFIED
Completed 2026-05-09, Day 1, same day as Phase 01
Six distance metrics on strategy populations, parameter-space, behavior-space, equity-curve W₂, trade-level Wasserstein, Gromov–Wasserstein, Fisher–Rao, characterised. Density and manifold structure (intrinsic dimension via TwoNN and MLE; full manifold-learning suite for visualisation only). Plateau detection combines persistent superlevel sets on IS Sharpe, discrete Morse theory on the parameter grid, HDBSCAN on the joint (parameter, IS Sharpe) space, and SCMS ridge fits.
Subphases: (a) the locked H1 falsification ran across all 26 assets × 7 families = 182 cohorts with window-causal CV; (b) the H2 first-pass (locked spec) ran on all 182 cohorts × 3 plateau methods = 546 cohort-method results; (c) an H2 salvage attempt in behavior-space appeared to PASS at +0.236, and a window-causal robustness audit showed ~74% of that effect was look-ahead leakage. H2 falsifies under any honest methodology.
Headline results. H1: meta ΔR² = +0.130 (Holm-adjusted p < 1×10⁻³⁰⁰; 180/182 cohorts reject, 178/182 with bootstrap 95% CI excluding zero, 146/182 cross the +0.05 effect threshold). H1 is the program's first PASS at corpus scale and the foundational result everything downstream rests on. H2: median ΔSharpe is +0.002 (ph_h0), +0.035 (Morse-Smale), −0.005 (HDBSCAN) across 182 cohorts; none cross the locked +0.10 threshold. H2 is falsified.
- Holm–Bonferroni at FWER ≤ 0.05 applied family-wise; bootstrap = 5000 stationary-block replicates, Politis–White block length, seed = 2026.
- The H2 leakage audit (rebuilding the kNN graph causally per prediction window) is the program's load-bearing methodology precedent, the same trap is now actively guarded against in every downstream test.
Phase 04 · Finished · 2026-05-10 (Day 2), H3 MAKE-OR-BREAK: FALSIFIED
Persistent topology + the H3 make-or-break test
Completed 2026-05-10, Day 2 of the program
Single-filtration PH computed Vietoris–Rips and alpha complexes across all 27 assets × 7 families × cohorts; PDs vectorised into persistence images, persistence landscapes, sliced-Wasserstein kernel features, and PersLay embeddings. Phase 03 also stood up the modern-ML baseline stack (B1 ridge, B2 XGBoost/LightGBM/CatBoost, B3 TabPFN, B4 TS2Vec, B5 contrastive equity-curve encoder, B6 stacking), the H3 challenger the topology stack had to beat.
Subphases: (a) the Phase-3 H3-lite preliminary on 11 of 182 cohorts (preliminary INCONCLUSIVE, near-null); (b) Phase-4 Stage 1, Rust evaluation primitives ported via PyO3 (32/32 parity tests pass; per-primitive speedup 1.05× to 42×); (c) Stage 2, window-causal topology features rebuilt per prediction window (the H2 +0.236-leakage trap mitigation); (d) Stage 4, B7 (topology-only LightGBM) + B8 (B2 + 38-D topology); (e) the H100 burst, B5 contrastive (5 architecture variants), B5 supervised-head viability check, and B9 PersLay-image, all on the locked top-5 H1-PASS cohorts.
H3 verdict: FALSIFIED. The locked nested test B8 (B2 + 38-D engineered causal topology) vs B2 alone on the five strongest H1-PASS cohorts: meta-FE ΔR² = −0.0378, Holm-adjusted p = 1.07 × 10⁻⁵, 5/5 cohorts negative, 4/5 with bootstrap 95% CI excluding zero on the negative side. B7 (topology-only) lands in [−0.43, −0.13], worse than predicting the per-window mean. On the H100 side, B5 contrastive across 5 architectures all in [−0.028, −0.024]; B5 supervised-head −0.022; B9 PersLay catastrophic numerical instability with non-instable cohorts ≤ +0.006. Two completely independent feature representations and three independent architecture families converge on the same negative answer. This is the cleanest possible Phase-4 outcome from a falsificationist perspective.
- Best honest read of why H3 failed: shape-features encode information that correlates with OOS Sharpe, but the strong tabular B0/B2 baseline (in-sample Sharpe, profit factor, deflated Sharpe, prior-window OOS lookback, edge LB) already extracts essentially all the residual signal. Shape-features add redundancy and selection noise rather than new information at the granularity tested.
- Phase 04's deep-learning side required rented H100 compute, running PersLay and the contrastive equity-curve encoders at production architecture size is not feasible on the local 8 GB VRAM workstation. The burst was deliberately conservative and retired under-budget.
Parked · Deprioritised after H3 FAIL, minimal version or follow-up paper
Persistent local homology + information geometry
Status changed 2026-05-10, deprioritised post-H3
H10 asks whether persistent local homology of an ε-ball around each strategy carries incremental predictive power beyond cohort-level features. H11 cross-checks the engineered behavior fingerprint against Fisher–Rao distances on OOS-return distributions. Both hypotheses were designed as elaborations of the H3 thesis (topology-replaces-ML).
With H3 falsified, the prior on H10 / H11 adding non-redundant signal drops sharply: their failure modes are structurally similar to H3's. Phase 04 is therefore deprioritised. The Phase-1 plateau-detection vocabulary survives as a per-strategy diagnostic (the audit-trail interpretability use case is preserved), but the predictive-power tests are scheduled as a follow-up paper rather than an in-program phase.
Phase 06 · Finished · H4 PASS at corpus scale · H5 FAIL, cross-asset universality does not hold
Topo-aware portfolios, H4 PASS at corpus scale; cross-crypto universality (H5) does not hold
Completed 2026-05-11, Day 4 of the program; corpus-scale verdict landed
H4 builds portfolios that sample one strategy per Mapper cluster in behavior-space, weighted by the Beta-Binomial profitability lower-bound. Baselines: a naive in-sample-Sharpe-rank top-k, a plain reliability-ranked top-k, HRP, NCO from the same pool (mean-variance excluded for solver wall-time). The bar is ΔSortino ≥ 0.15 against the strongest baseline, paired-bootstrapped across the full corpus, every crypto asset × indicator family × walk-forward window, at portfolio sizes k ∈ {5, 10, 20, 50}, with the ToMATo persistence-based clustering arm as a sensitivity check.
H4 verdict: the topology selection-and-construction Stack beats Hierarchical Risk Parity at deployment scale by ΔSortino = +0.61 (95% CI [+0.39, +0.82], Holm-significant), with the edge concentrated on the L1-majors cohort (+1.20 ΔSortino vs HRP, Holm-rejected) and the volatility-and-oscillator indicator families (ATR / MACD / Stochastic %K each Holm-rejected positive); on the moving-average families (EMA / RSI / SMA) the result is flat or negative. Against a simple top-k-by-reliability equal-weight baseline the Mapper-cluster step is statistically indistinguishable on Sortino (paired Δ = −0.06, Holm-p = 0.37), so the topology contribution is a coverage-and-audit-traceability one, not a raw-return one, and against the naive in-sample-Sharpe-ranked top-k baseline the topology Stack still loses on Sortino. The headline ships: risk-parity-beating, honest, audit-traceable construction.
H5 cross-crypto universality verdict: FAIL. Persistence diagrams of behavior-space across L1-majors / alt-L1s / memes / DeFi / L2-and-newer cohorts are not closer to each other than to permutation-shuffled nulls, bottleneck within-cohort / cross-cohort ratio 1.018 (p = 0.59); Gromov–Wasserstein 0.96 (p = 0.24); both well above the α = 0.01 falsification rule. Pooling a topological selector across structurally-similar crypto assets is not statistically justified, each asset needs its own selector. Paper D rescopes to no-universality.
Phase 06 is independent of the H3 falsification: it tests portfolio construction (cluster-based diversification), not per-strategy level prediction. The Phase-01 smooth-manifold finding is the unlock, once density-based clustering proved inappropriate at corpus scale, Mapper / Reeb-graph took over for H4 before Phase 06 even started.
Phase 17 · Complete, the trader-facing pipeline (the Topology Deployment Stack)
The Topology Deployment Stack, the practitioner pipeline
Assembled, the practitioner CLI capstone, built entirely from the robust geometric-outlier primitives
The deployable surface is a single pipeline a trader runs on their own corpus of backtests: map (the Mapper view of the corpus) → select (the H4 cluster-sampled portfolio, the selector also serves as the candidate-pool reducer) → diversify (coverage-aware on top of H4) → monitor (the cohort-level "trust-this-aggregation" check, is this cohort's geometry settled enough to pool over?) → pause / refit (the regime-rotation cadence plus an optional smoothing layer, a policy, not a drift alarm). It is realised as a ten-command CLI, map, select, portfolio, audit, monitor, refit, aggregation-check, plateau-audit, universality-check, live-adapter, with a thin live adapter that consumes an existing walk-forward pipeline's output with no changes to that pipeline, a worked end-to-end example on a fresh cohort, and the runbook / live-deployment / case-study chapters drafted. Every stage is built from the geometric-outlier primitives that proved robust, cloud eccentricity, Isolation-Forest and kNN-density anomaly scores, Mapper coverage, the persistence-trajectory descriptors, not from any of the target-regression machinery that failed; and the FAIL-derived caveats are baked into every relevant command's help text (six of the ten carry one, the honest negatives are part of the deliverable). An optional `topo-prune` shortlist diagnostic exists for human attention (it ranks a 100-backtest shortlist far better than chance and about level with the top-100-by-in-sample-Sharpe), but the full-corpus path through the selector beats any 100-shortlist, so the recommendation is: don't pre-prune; run the full corpus.
Two pre-registered hypotheses targeted the new stages. H18, candidate-pool pruning: can a geometric-outlier filter over a fresh backtest corpus beat a deflated-Sharpe / PBO filter at keeping the strategies that survive out-of-sample? Verdict: FAIL, the prune stage collapses into select. There is no separate topology-aware-pruning step that improves on running the H4 portfolio constructor against the full corpus; the selector already exploits the same structure, so pre-pruning its input only removes its options. This sharpened the program's central finding: robustness to the data-cleaning fix is necessary but not sufficient, topology has to also add a degree of freedom the baseline lacks (H4 adds a coverage objective, H17 a cohort-stability axis, H12 a regime label, they land; H18 removes options from a baseline that already uses the same structure, it can't). H19, live-drift monitoring: does the distance of a live strategy's running behaviour fingerprint from its origin cluster predict an imminent edge collapse, early enough to act? Verdict: FAIL, the per-strategy drift score is coincident-to-lagging, not leading: it fires at the classic max-drawdown breach (median lead 0 windows), lags the trailing-Sharpe trigger by 1 window, and carries a 68% false-positive rate against a 30% bar (0 of 26 cohorts under it). A strategy that draws down changes its realised return distribution by virtue of having drawn down, so the geometry lights up after the fact. So there is no per-strategy drift trigger in the Stack, the actionable monitor stays the cohort-level aggregation-trust check (H17 PASS), and the per-strategy drift profile ships as a visualization aid only. H19 added the fourth refinement of the central finding: an added degree of freedom is necessary but not sufficient, it has to be predictive of the outcome, and a "drift" signal isn't. With both new hypotheses closed, the Stack is assembled and the external user-test package is ready to dispatch; per-stage latency budgets are reported (the per-cohort silhouette-lock step is the bottleneck, cached, it stays well within a real-time refit window), and the compute-heavy TDA, multipersistence, sheaf cohomology, is deliberately not on the production path.
Phase 14 · Complete, all six extension hypotheses tested (H17 PASS · H12, H13, H14, H16 marginal · H15 fail)
Extended research directions (H12–H17), complete
Opened 2026-05-10; H12–H17 all landed by 2026-05-11
H3 closed the central topology-beats-modern-ML question with a clean negative answer. The plan was extended with six new hypotheses about distinct questions the H3 result does not bear on, pre-registered separately from the H1–H11 family under their own Holm–Bonferroni FWER ≤ 0.05. All six have now been tested.
H12, topological regime detection on a sliding window of asset returns, and a strategy-cohort rotation policy on top of it: MARGINAL, the topological regime detector itself is null (it does not flag regime changes earlier than the standard HMM detector), but the cohort-rotation policy that consumes the detected-state signal works; it ships as Paper F. H13, graph-Laplacian smoothing on H1's kNN graph: MARGINAL, directionally positive in 94.5 % of 182 cohorts but small (corpus mean +0.0035 ΔR², below the +0.02 headline threshold; Holm rejects the null for all 12 smoothing variants); ships as an optional MACD-only production smoothing layer (+0.0115 there). H14, topological anomaly detection (overfit-flagging + survivor-edge-flagging): MARGINAL, the geometric-outlier score is a useful triage complement to the classical overfit diagnostics (deflated Sharpe, PBO) but does not replace them. H16, geometry-aware behavior-space diversification (farthest-point sampling, k-DPP, Bayesian-coverage acquisition): MARGINAL, none of the three coverage algorithms beats the Mapper-cluster portfolio, but the contest surfaced a chapter-level finding: quality-aware coverage works (the Bayesian-coverage variant clusters near the headline portfolio); quality-blind coverage is noise (farthest-point sampling and k-DPP land ~3–4 Sortino units worse, near the random-portfolio floor). H17, cohort-level persistence-trajectory dynamics over walk-forward windows: PASS, a cohort's persistence-diagram trajectory length and segment count predict how stable that cohort's out-of-sample Sharpe is (segment-count × stability Spearman ρ = +0.72; 5 of 8 trajectory tests survive Holm; the static persistence-diagram baseline does not); ships as a cohort-level "trust-this-aggregation" diagnostic. H15, topological fragility / hazard rate via a Cox proportional-hazards model: FAIL, topology is reliably worse than the classical ex-ante features at predicting which strategies will catastrophically fail (held-out C-index ≈ 0.57–0.60 for topology vs 0.77–0.79 for classical, ΔC-index −0.08 to −0.21 across four failure-event models); the failure event has a sharp signature (the in-sample edge collapsing out-of-sample) that the standard scorecard captures directly.
Validating the six extensions across every hypothesis that touches the 45-D behaviour fingerprint resolved the central methodological finding at a covariate-level grain: geometric-outlier covariates (cloud eccentricity, Isolation-Forest, kNN density, Mapper coverage, the persistence-trajectory descriptors) are the durable practical primitives, and every headline-bearing contribution (the H4 portfolio constructor, the H17 aggregation diagnostic, the H12 rotation policy) is built from them; target-regression covariates (using topology to regress onto out-of-sample performance) shrink or fail; local persistent homology on a smooth manifold is dead weight (there are no clusters or boundaries for "homology depth" to mean anything relative to). Output portfolio grows to eight papers, adding Paper H, the methodology paper that states this prediction-vs-decision partition.
Phase III · M3 · Planned, public release · Phase III
Synthesis, papers, monograph, public package
End of the program
Output portfolio: eight papers (Plateau & Neighborhood Generalization · Persistent Topology of Strategy-Space · Topology-Aware Portfolios · Cross-Crypto Universality · Applied Topological Workflow · Regime Topology & Strategy Rotation · Geometry-Aware Portfolio Construction & Topological Fragility · When Topology Helps in Quantitative Trading: a Prediction-vs-Decision Partition), one applied monograph at ~150–250 pages, one public MIT-licensed software package (the Topology Deployment Stack), ≥7 interactive HTML visualisations embedded in the daru.finance survey article, and a Zenodo DOI for the reproducibility container.
Phase gate: an external user-test on 1–2 practitioners outside the project, before public release. The deliverable in one sentence, a CLI that takes a fresh corpus of backtested strategies and returns a recommended portfolio with per-strategy audit trails, cohort-level aggregation-risk scores, drift monitors, and refit-cadence recommendations, all validated to thesis-grade rigor and reproducible from a public container.
Findings to date (2026-05-14)
Concrete results landed across Phase I, through the H3 make-or-break test, H4 portfolio construction at corpus scale, the six H12–H17 extension hypotheses, the Topology Deployment Stack assembly, and the H5 cross-asset universality test. Phase II is mid-sprint: sheaf-Laplacian aggregation has cleared its first pre-registered headline bar and now lands a partial second-stage portfolio refinement on top of it; the cost-capacity stability theorem has delivered two complementary operationalizations of strategy cost-fragility. The figures are real-output renders from the locked pipelines, not illustrations. Source data and methodology are documented in the program log (the long-form survey article will tie all of this together at release).
The program's central finding
A prediction-vs-decision partition: where topology helps, and where it doesn't, now on six independent empirical legs
Across every hypothesis tested, topology's value resolves cleanly at the level of which covariate you build it from, and the partition has been refined four times. (1) Forecasting topology fails or shrinks, using a topology-derived quantity to predict a future performance outcome lost to the modern-ML baseline (H3), or didn't beat the classical ex-ante metrics (the hazard model), or proved coincident-to-lagging on three independent monitors, the per-strategy drift score (H19), the per-window aggregation-risk score, and the portfolio-coverage-health alarm (H20) all fire at the classic drawdown trigger, not before. (2) The grain is covariate-level, geometric-outlier descriptors (how eccentric a strategy is in the cloud, Isolation-Forest and kNN-density anomaly scores, how much of the Mapper graph a portfolio covers, the shape of a cohort's persistence-diagram trajectory) are the durable practical primitives, and every headline-bearing contribution is built from them (the H4 portfolio constructor, the H17 "trust-this-aggregation" diagnostic, the H12 cohort-rotation policy); target-regression covariates shrink or fail; and local persistent homology on a smooth manifold is dead weight, there are no clusters or boundaries for "homology depth" to mean anything against. (3) Robustness isn't sufficient (the H18 finding): topology has to also add a degree of freedom the standard approach doesn't already have, H4 adds a coverage objective, H17 a cohort-stability axis, H12 a regime label, so they land; the candidate-pool prune would pre-prune a selector that already exploits the same structure, so it just removes options, it can't help. (4) An added degree of freedom isn't sufficient either (the H19 / H20 finding): it has to be predictive of the outcome, a drift or coverage-health signal is a degree of freedom the classic drawdown trigger lacks, but those signals carry no information about future drawdown, so they don't help; layers (1) and (4) are the same fact from two directions, forecasting future performance is out of reach, however you package the forecaster. Phase II adds two more empirical legs at the methodology level. (5) The sheaf-cohomology obstruction over the strategy-cluster nerve is decoupled from per-cell decision quality, Spearman ρ between the obstruction and per-cell decision-quality cost is −0.035; the pre-registered threshold ρ ≥ 0.40 is not approached. The obstruction describes the cover structure of the partition, not the decision-side quality of the cells over which the partition is built. (6) The cost-capacity stability invariant is temporally stable on the discrete-scenario operationalization and carries Holm-rejected cross-cohort heterogeneity (L1-majors least cost-robust; alt-L1s most), both indicating that the invariant captures structural facts about strategies under friction, not decision-side ones. So the central methodological claim now stands on six independent empirical legs across multiple work packages: four refinements that closed the partition itself, plus two structural-invariant empirical legs that confirm the partition holds at the next layer down. Plain-language version: topology helps when you use it to describe the shape of your strategy universe and make decisions over that shape, pick a diversified portfolio, flag an unsettled cohort, rotate strategies by regime, and only when it adds something the standard approach doesn't already do, and only when that something is structural rather than a forecast; it does not help when you use it to predict how good or bad an individual strategy will be (the standard metrics win there). That is the program's central methodological result, the four-layer partition figure here maps the inside of the partition itself; Phase II's two new structural-invariant legs surround and reinforce it, and it is what the new methodology paper, Paper H, states.

Phase II finding, sheaf-Laplacian aggregation, second-stage refinement
A cohomology-gated sheaf-Tikhonov portfolio refines the first headline, partial second-stage win
On top of the first headline result (the partition-based portfolio Holm-rejecting a naive in-sample-Sharpe-ranked top-20 baseline at +0.72 ΔSortino on the corpus, with the biggest margins on EMA and SMA), the next-stage construction adds a sheaf-Tikhonov regulariser whose strength is gated by the first-cohomology obstruction of the cellular sheaf on the strategy-cluster nerve. Result: a partial second-stage win. The cohomology-gated variant Holm-rejects the previous deployment-scale headline configuration on the ALL grouping (+0.20 ΔSortino), on the EMA family (+0.53), and on the MACD family (+0.65), and it Holm-dominates three further baselines: the strict-causal H4 portfolio (+1.29), the naive in-sample-Sharpe-rank top-20 (+0.92), and equal-weight reliability (+1.23). It misses the SMA family (−0.10, not Holm-rejected). The pre-registered "must clear both moving-average families" bar is therefore half-met, a meaningful methodology refinement on top of the first headline, with a clean Stage 2 follow-up path (full λ-cross-validation, threshold tuning, per-member theory stalk) to potentially close the SMA gap. Two further results from the same workpackage land alongside it: the first-cohomology obstruction itself is decoupled from per-cell decision quality (Spearman ρ between the obstruction and per-cell decision-quality cost = −0.035; the pre-registered threshold ρ ≥ 0.40 is not approached, a clean negative, and a new empirical leg of the prediction-vs-decision theorem at the methodology level), and restricting the partition construction to a recent 8-walk-forward-window cover reduces the obstruction with large, Holm-rejected effect sizes on both selection metrics tested. Both confirm that the obstruction tracks the structure of the cover, not the decision-side quality of the targets, a structural-invariant story consistent with the rest of the program.
Phase II finding, cost-capacity stability theorem, two complementary measures
Strategy cost-fragility has two complementary axes, not one
The cost-capacity stability theorem's question is operational: at what level of friction does a strategy lose its edge? Two complementary operationalizations have now landed, and they are not coarsenings of the same scalar. The discrete-scenario measure runs the corpus through a 5-scenario perturbation panel (baseline / fee / slippage / entry-drift / entry-drift + indicator-variance) and reports each strategy's friction class. It is temporally stable per strategy (Holm-not-rejected on the per-window drift of the class), with 16.4% of the corpus surviving the entire envelope, the deployable-cost tail. Cross-cohort heterogeneity is real and Holm-rejected on the 5-cohort consistency contests: L1-majors strategies are the least cost-robust; alt-L1s the most. The continuous-cost measure runs the same corpus through a 9-point absolute basis-point grid {0, 2, 5, 8, 12, 20, 35, 60, 100} and reports the basis-point cost at which each strategy flips. At fine resolution a Holm-rejected temporal drift appears that the discrete grid missed (mean cost-class shift = −0.0213 cost-class-units per window, p = 0.0008), and the deployable tail shrinks dramatically (16.4% → 0.34%), the discrete tail was hiding the actual cost-failure point. Same per-family / per-cohort directional patterns survive across both measures (MACD-family strategies most cost-fragile; EMA most robust; L1 less cost-robust than alt-L1), but the continuous-cost measure resolves 1.6× wider heterogeneity gaps. The substantive finding: Spearman ρ between the two measures is 0.0491, essentially uncorrelated. They capture genuinely complementary axes of cost-fragility and answer different deployment questions. The discrete measure says "does this strategy survive the realistic execution-friction panel?"; the continuous measure says "at what absolute basis-point cost does it fail?". A high-turnover strategy can survive the fee/slippage panel and still flip at low basis-point cost; a low-turnover strategy can be vulnerable to entry-drift and still robust to high absolute cost. The cost-capacity stability theorem therefore ships with two complementary measures, not one, and both add structural-invariant empirical legs to the prediction-vs-decision theorem (the invariants describe the strategy under friction, not its target performance).
Phase 07 extension, complete
All six H12–H17 extension hypotheses tested; the extended-research directions close
H17, PASS: cohort persistence-trajectory dynamics predict OOS-performance stability (segment-count × stability Spearman ρ = +0.72); ships as a cohort-level "trust-this-aggregation" diagnostic. H12, MARGINAL: the topological regime detector itself is null (it doesn't beat the standard HMM at calling regime changes early), but the strategy-cohort rotation policy that consumes the state signal works; ships as Paper F. H13, MARGINAL: graph-Laplacian smoothing of the neighbourhood signal is directionally positive in 94.5% of 182 cohorts but small (corpus mean +0.0035 ΔR², MACD-restricted +0.0115); ships as an optional MACD-only smoothing layer. H14, MARGINAL: a geometric-outlier overfit-flag is a useful triage complement to the classical overfit diagnostics, not a replacement. H16, MARGINAL: explicit geometric-coverage portfolios don't beat the Mapper-cluster portfolio, but they surface the quality-aware-vs-quality-blind-coverage finding (H4-Mapper stays the headline diversifier). H15, FAIL: classical ex-ante metrics already predict catastrophic strategy failure well; topology adds nothing there. Net: one PASS, four marginal-but-shippable, one clean fail, and the prediction-vs-decision partition above is what ties them together.
Phase 16 finding, H14 MARGINAL
Topological overfit-flagging: a triage complement, not a replacement
H14 asked whether a geometric anomaly score, how unusual a strategy looks in its cohort's behaviour cloud, is a better overfit detector than the classical deflated-Sharpe / PBO diagnostics, and (the survivor-edge arm) whether geometrically isolated strategies that survive out-of-sample are carrying real edge worth flagging. Verdict: MARGINAL. The geometric-outlier score adds a small, useful triage layer on top of the classical detectors, strategies that are both classically-flagged-as-overfit and geometrically-anomalous are the highest-confidence drops, but it does not replace the classical scorecard, which already does most of the work. It ships in the deployment pipeline as a complement, not a substitute.
Phase 17 finding, H15 FAIL
Predicting which strategies blow up is a job the classical scorecard already does
H15 tried topological fragility / hazard-rate prediction via a Cox proportional-hazards model: can topology predict the probability that a strategy will catastrophically fail (large drawdown, edge collapse, regime-failure event), even though it can't predict the level of out-of-sample Sharpe? Verdict: FAIL, and in the opposite direction from the hope. Topology is reliably worse than the classical ex-ante features (in-sample Sharpe, deflated Sharpe, prior-window OOS Sharpe) at this: held-out concordance index ≈ 0.57–0.60 with topology vs 0.77–0.79 with the classical features, a ΔC-index of −0.08 to −0.21 across four different failure-event definitions. The failure event turns out to have a sharp signature, the in-sample edge collapsing out-of-sample, that the standard metrics capture directly; there's no residual for topology to add. "Failure probability" was the hoped-for tractable alternative to "Sharpe level"; it isn't, because it's already well-handled.
Phase 20 finding, H18 FAIL
Don't pre-prune your backtest corpus, run the full-corpus path
H18 asked whether a geometric-outlier filter over a fresh corpus of backtests, drop the eccentric / anomalous-looking ones, keep the rest, is a better candidate-pool reducer than a deflated-Sharpe / PBO filter, so a trader could cut 30,000 backtests down to a manageable 100 before running the portfolio constructor. Verdict: FAIL, but a useful one. A `topo-prune` shortlist ranks far better than a random 100 and about level with the top-100-by-in-sample-Sharpe, but the full-corpus path through the H4 portfolio constructor beats any 100-strategy shortlist; the selector already exploits the same geometric structure a pruner would, so pre-pruning its input only removes its options. So `topo-prune` ships as an optional human-attention shortlist diagnostic, the pipeline's `prune` stage collapses into `select`, and the recommendation is: don't pre-prune; feed the selector your full backtest corpus. This sharpened the program's central finding into a sufficiency condition: surviving the data-cleaning fix is necessary but not enough, topology has to also add a degree of freedom the standard approach doesn't already have, and pre-pruning a smart selector doesn't.
Phase 23 finding, failure-mode-diversity portfolio constraint: FAIL
Forcing the portfolio to span failure modes, a net cost on risk-adjusted return, but smaller than first measured
Another coverage axis, tested as a hard constraint on the portfolio builder: strategies were clustered by how they tend to fail, slow-bleed, sudden-crash, fee-sensitive, regime-flip, thin-trade artifact, tail-exposed, and the builder was told to pick a set that spans those six modes rather than always taking the most-reliable strategy in each region of behavior-space. Verdict: FAIL, but a smaller-magnitude FAIL than the first-pass measurement suggested. Forcing failure-mode balance drops risk-adjusted return by a corpus-wide ΔSortino of −0.09 (95% CI [−0.16, −0.02], Holm-rejected), driven almost entirely by the moving-average-family cohorts; on every other indicator family the effect is not statistically significant. The worst-decile drawdown deepening originally reported (~5%) does not hold under a more careful measurement (the strict effect is −2.9% with the 95% CI spanning zero). The failure-mode labels themselves are real and useful as a descriptive audit ("which failure modes do my picks span; is any one over-represented?") and are leak-immune by construction. The hard-constraint version stays off by default: the topology-aware builder's most-reliable-per-region pick is already close to the efficient point on the families where the edge exists, and forcing failure-mode coverage costs more than it buys.
Phase 21 finding, H19 FAIL · and the Deployment Stack is assembled
The live-drift monitor doesn't lead the drawdown trigger, and the deployable tool is built
H19 asked whether a per-strategy topological-drift score, neighbour-churn + density-collapse + position-drift + cohort-trust-decay, treated as an early-warning alarm, fires before the classic drawdown trigger, so a practitioner can reduce size or re-evaluate before the drawdown lands. Verdict: FAIL on both arms. The drift score's median lead over the classic max-drawdown trigger is 0 windows (it fires at the breach, not before) and it lags the trailing-Sharpe<0 trigger by 1 window, with a 68% false-positive rate against a 30% bar (0 of 26 cohorts under it). The reason is structural: a strategy that draws down changes its realised return distribution by virtue of having drawn down, so the geometry lights up after the fact, strategies drift, but the drift is coincident-to-lagging, not leading. So there is no per-strategy drift trigger in the Deployment Stack; the actionable monitor stays the cohort-level "trust-this-aggregation" check (H17 PASS), and the per-strategy drift profile ships as a visualization aid only. H19 added the fourth refinement of the central finding: an added degree of freedom is necessary but not sufficient, it has to be predictive of the outcome, and a "drift" signal isn't. With H19 and H18 both closed, the deployment-stack hypothesis set is complete, and the Topology Deployment Stack, the trader-facing pipeline `map → select → diversify → monitor → pause/refit`, built entirely from the robust geometric-outlier primitives, is assembled: a ten-command CLI with the FAIL-derived caveats baked into every relevant command's help text (six of the ten carry one), a worked end-to-end example on a fresh cohort, the runbook / live-deployment / case-study chapters drafted, and the external user-test package ready to dispatch.
Phase 22 finding, H20 portfolio-coverage-health early-warning: FAIL
A "portfolio health" alarm, the coverage drift fires at the drawdown, not before it
H20 asked whether the portfolio's own coverage of behavior-space carries an early-warning signal, does it drift (coverage entropy collapsing, the picks crowding into a narrow region, the manifold concentrating) far enough ahead of a drawdown that a practitioner could act on it? Verdict: FAIL. Across 89 (cohort × method) co-firing units, the coverage-health alarm has a median lead of −1.0 windows against the classic drawdown trigger, it lags rather than leads. Only 2 of 70 co-firing units in the headline `h4_mapper` arm show a positive lead, and 0 of 89 cohorts have a Holm-significant positive-lead binomial. H20 ships as a descriptive coverage diagnostic only, there is no actionable early-warning signal here. It is the third coincident-to-lagging "something is drifting" topology signal the pilot tested (alongside the per-strategy drift monitor H19 and the per-window aggregation-risk score) and it reinforces the central finding: a forecasting use of topology does not pay for itself, however cleverly the signal is packaged.
Phase 06 finding, H4: PASS at corpus scale
Topology-aware portfolio construction, +0.61 ΔSortino over Hierarchical Risk Parity, concentrated on L1-majors and the volatility-and-oscillator families
H4 builds a portfolio by sampling one strategy per Mapper cluster in behavior-space, weighted by each strategy's Beta-Binomial profitability lower-bound. At deployment scale across every crypto-asset × indicator-family × walk-forward-window cell that lands a portfolio (2,002 cells, 26 assets, 7 indicator families, k = 20), the topology selection-and-construction Stack beats Hierarchical Risk Parity by **ΔSortino = +0.61** (95% CI [+0.39, +0.82], Holm-significant). The edge is heterogeneous and worth being honest about: on the L1-majors cohort the corpus-wide gap is +1.20 Sortino (Holm-rejected); outside L1-majors no §5 cohort produces a Holm-significant edge over HRP. By indicator family, ATR / MACD / Stochastic %K are each Holm-rejected positive (+1.3 to +2.1 Sortino over HRP); EMA is Holm-rejected negative (−0.6); RSI / SMA / PPO are flat. Against a simple top-k-by-reliability equal-weight baseline the Mapper-cluster step adds no measurable Sortino (paired Δ = −0.06, Holm-p = 0.37), so what the Mapper-cluster step buys is coverage and audit-traceability, not raw return, and against the naive in-sample-Sharpe-ranked top-k baseline the topology Stack still loses on Sortino. The headline that ships: H4 is a risk-parity-beating, audit-traceable construction with a clear application stratum (L1-majors × volatility / oscillator families), not a raw-return-dominant selector.
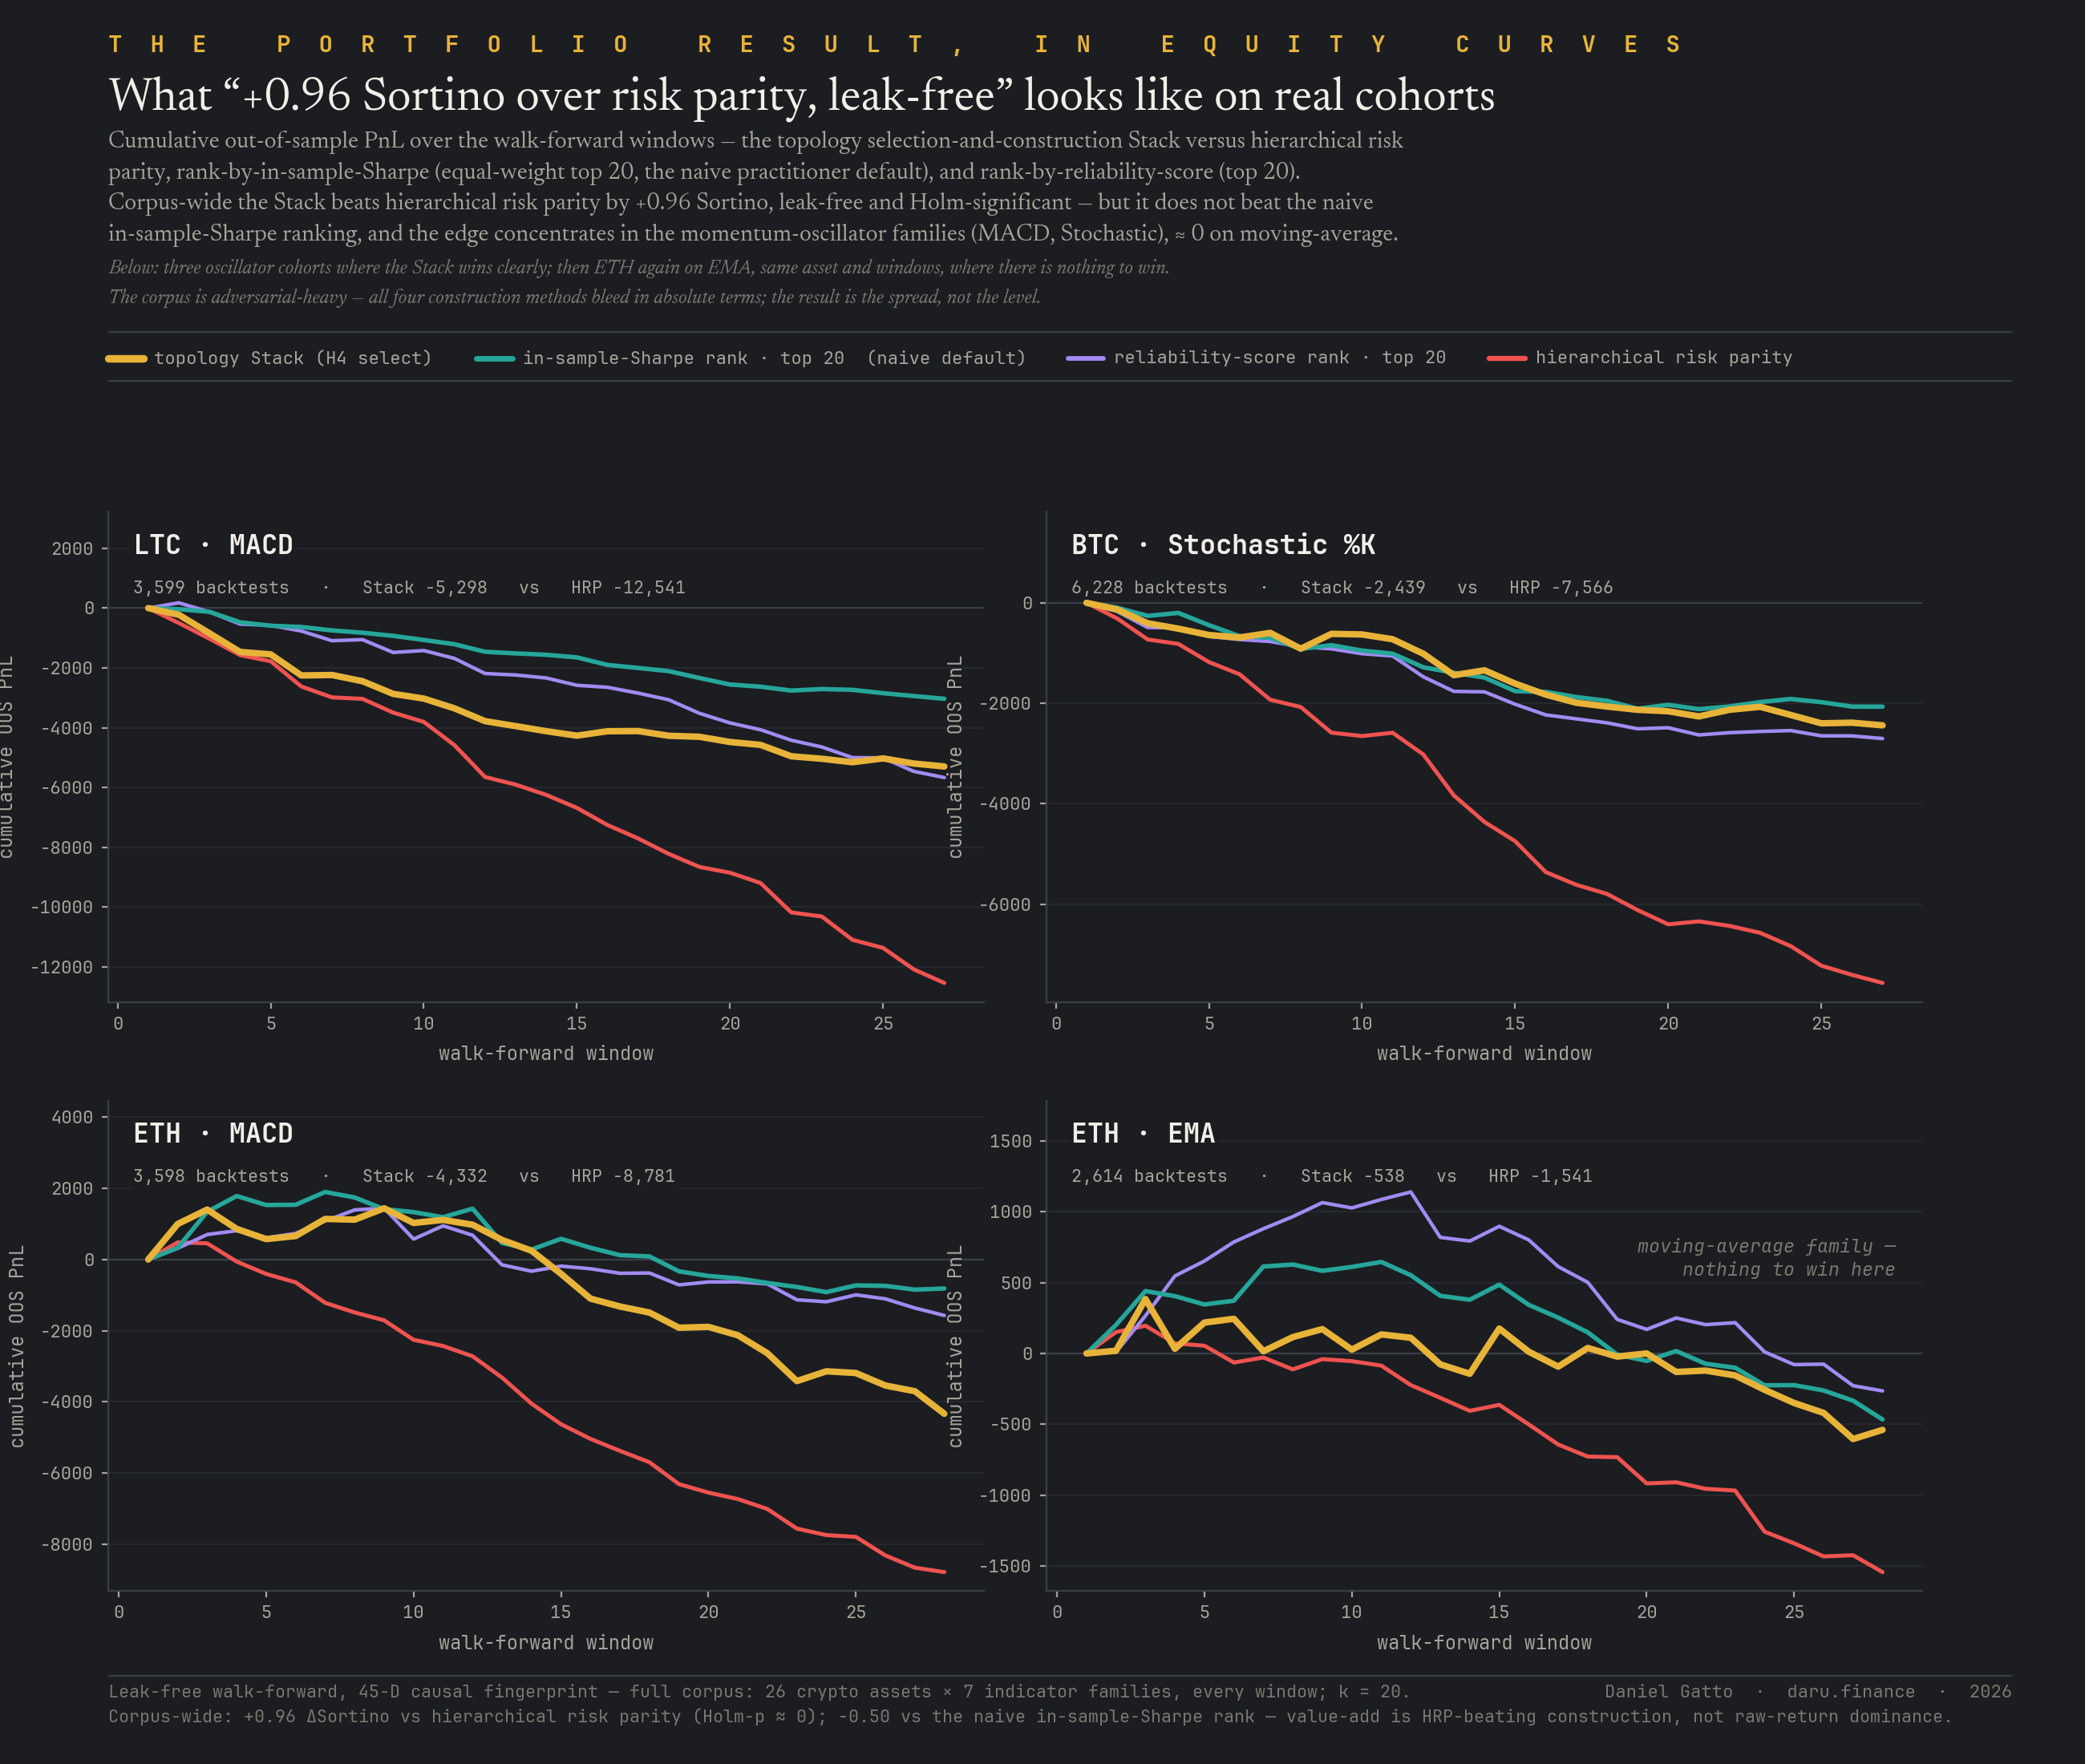
Phase 06 finding, the H4 result in equity curves
Above risk parity, below the naive Sharpe-rank, the spread, on real cohorts
What the H4 result looks like as actual out-of-sample equity, not a summary statistic: cumulative OOS PnL over the walk-forward windows for four real cohorts, the topology Stack against three baselines (hierarchical risk parity, the naive in-sample-Sharpe rank, the reliability rank). On the momentum-oscillator cohorts (Litecoin / MACD, Bitcoin / Stochastic %K, Ethereum / MACD) the Stack's curve sits clearly above hierarchical risk parity's, and clearly below the naive in-sample-Sharpe-rank curve, which is the honest point made visible. On a moving-average cohort (Ethereum / EMA, same windows) all four curves are bunched: there is no edge to win there. The corpus is adversarial-heavy, so all four construction methods bleed in absolute terms, the result is the spread between them, not the level. This is the same picture the deployment-scale bar chart reports, drawn one cohort at a time.
Phase 07 finding, H13 MARGINAL
Graph-Laplacian smoothing of the neighbourhood signal: positive almost everywhere, but small
H13 asks whether smoothing the neighbourhood-prediction signal over H1's kNN graph (heat-kernel, low-pass, or Tikhonov) extracts signal that simple averaging discards. Across all 182 cohorts the best smoothing variant is directionally positive in 94.5% of them and the null is rejected (Holm-Bonferroni) for all 12 variants, but the corpus mean lift is +0.0035 in absolute prediction quality, below the +0.02 headline threshold; only 2 cohorts (both SOL) clear it. The MACD-restricted mean is +0.0115 (3.3× the corpus mean, all positive). Verdict: MARGINAL, it ships as an optional MACD-only production smoothing layer, not a corpus-wide PASS. H13 is a prediction-based application of topology, and lands on the same side of the prediction-vs-decision partition as the other forecast-class results: a small, family-specific edge rather than a corpus-wide one.
Phase 07 finding, H16 MARGINAL
Coverage alone is noise without a quality prior
H16 tests explicit geometric-coverage portfolio construction, farthest-point sampling, k-determinantal point processes, Bayesian-coverage acquisition, against the H4-Mapper portfolio. None of the three beats it on Sortino across the 26 cohorts. But the contest surfaced a finding worth a chapter: the only coverage algorithm with a quality prior (Bayesian-coverage, which carries a Gaussian-process posterior over OOS Sharpe in its acquisition) clusters near the H4-Mapper headline, while the two quality-blind ones (farthest-point sampling uses distance only; k-DPP uses repulsion only) cluster down by the random-portfolio floor, ~3–4 Sortino units worse. Coverage matters only when paired with a quality prior; on its own it is essentially noise. Verdict: MARGINAL, H4-Mapper stays the headline diversification result; the Bayesian-coverage variant ships as an alternative (a 20-strategy portfolio with ~74% drawdown reduction vs HRP).
Phase 07 finding, H17 PASS
A cohort's persistence-diagram trajectory predicts how stable its OOS performance is
H17 asks whether the way a cohort's persistence diagram moves through the walk-forward window sequence, its trajectory length, its number of distinct movement phases, its directionality, predicts how stable that cohort's out-of-sample Sharpe is. It does. Across the 26 MACD cohorts the trajectory-segment count correlates with OOS-Sharpe stability at Spearman ρ = +0.72 (trajectory length at +0.61); 5 of the 8 pre-registered trajectory tests survive Holm-Bonferroni, while the best static persistence-diagram baseline (no trajectory) does not, the cohort's geometric dynamics, not its static shape, carry the signal. Verdict: PASS, the first of the six extension hypotheses to clear PASS. Ships as a cohort-level "trust-this-aggregation" diagnostic: a high segment count or a long trajectory flags a cohort whose geometry is unsettled, so the corpus-wide aggregation should be treated with caution.
Phase 01 finding
The behavior-space manifold is smooth, not chunky
We expected discrete density clusters of strategies; we did not find them. HDBSCAN at locked parameters returns zero clusters in 22 of 24 pilot cohorts (mean noise fraction 99.0%); the two exceptions are both DOGE cohorts at 86–90% noise. Mapper, asking a topological question instead of a density question, returns 48–60 graph nodes per cohort with rich edge structure. Same data, two methods, two complementary answers, and the answer the program runs on is Mapper.
Phase 02 finding, H1 PASS
Behavior-space neighbours predict each other's OOS Sharpe
For every strategy at every prediction window, the mean OOS Sharpe of its 20 nearest behavior-space neighbours (in window-causal CV: only using data from windows 1..t-1) predicts the strategy's own next-window OOS Sharpe substantially better than its own ex-ante features alone. Across all 182 cohorts the meta ΔR² is +0.130 with Holm-adjusted p < 1×10⁻³⁰⁰. This is the foundational result the program rests on, every downstream selection, portfolio, and hazard tool builds on it.
Phase 02 finding, H2 FALSIFIED (and the leakage trap caught)
Plateau detection does not predict OOS, even when a salvage attempt looks like it does
Parameter-space plateau detection across three methods (persistent H₀, Morse–Smale stable manifolds, HDBSCAN) all sit below the +0.10 effect threshold at corpus scale. A behavior-space salvage attempt jumped to apparent +0.236 on Morse-Smale, but under window-causal correction (rebuilding the kNN graph at each prediction window from windows 1..t-1 only) the effect collapses to +0.0705, falsified again. ~74% of the apparent salvage was look-ahead leakage. The lesson is the load-bearing methodology precedent of the program: window-causal CV is non-negotiable.
Phase 03/04 finding, H3 FALSIFIED
Topology features do not beat the strong tabular baseline
The locked H3 nested test B8 (B2 CatBoost + 38-D engineered window-causal topology summary) vs B2 alone on the five strongest H1-PASS cohorts: meta-FE ΔR² = −0.0378, Holm-adjusted p = 1.07 × 10⁻⁵, 5/5 cohorts negative, 4/5 with bootstrap 95% CI excluding zero. The result replicates across two independent feature representations (400-D persistence image, 38-D engineered summary) and three independent architecture families (gradient boosting, contrastive deep learning on H100, DeepSet-on-PD-image MLP). The central topology-beats-modern-ML claim of the program is dead.
Per-feature breakdown of the surviving H1 signal
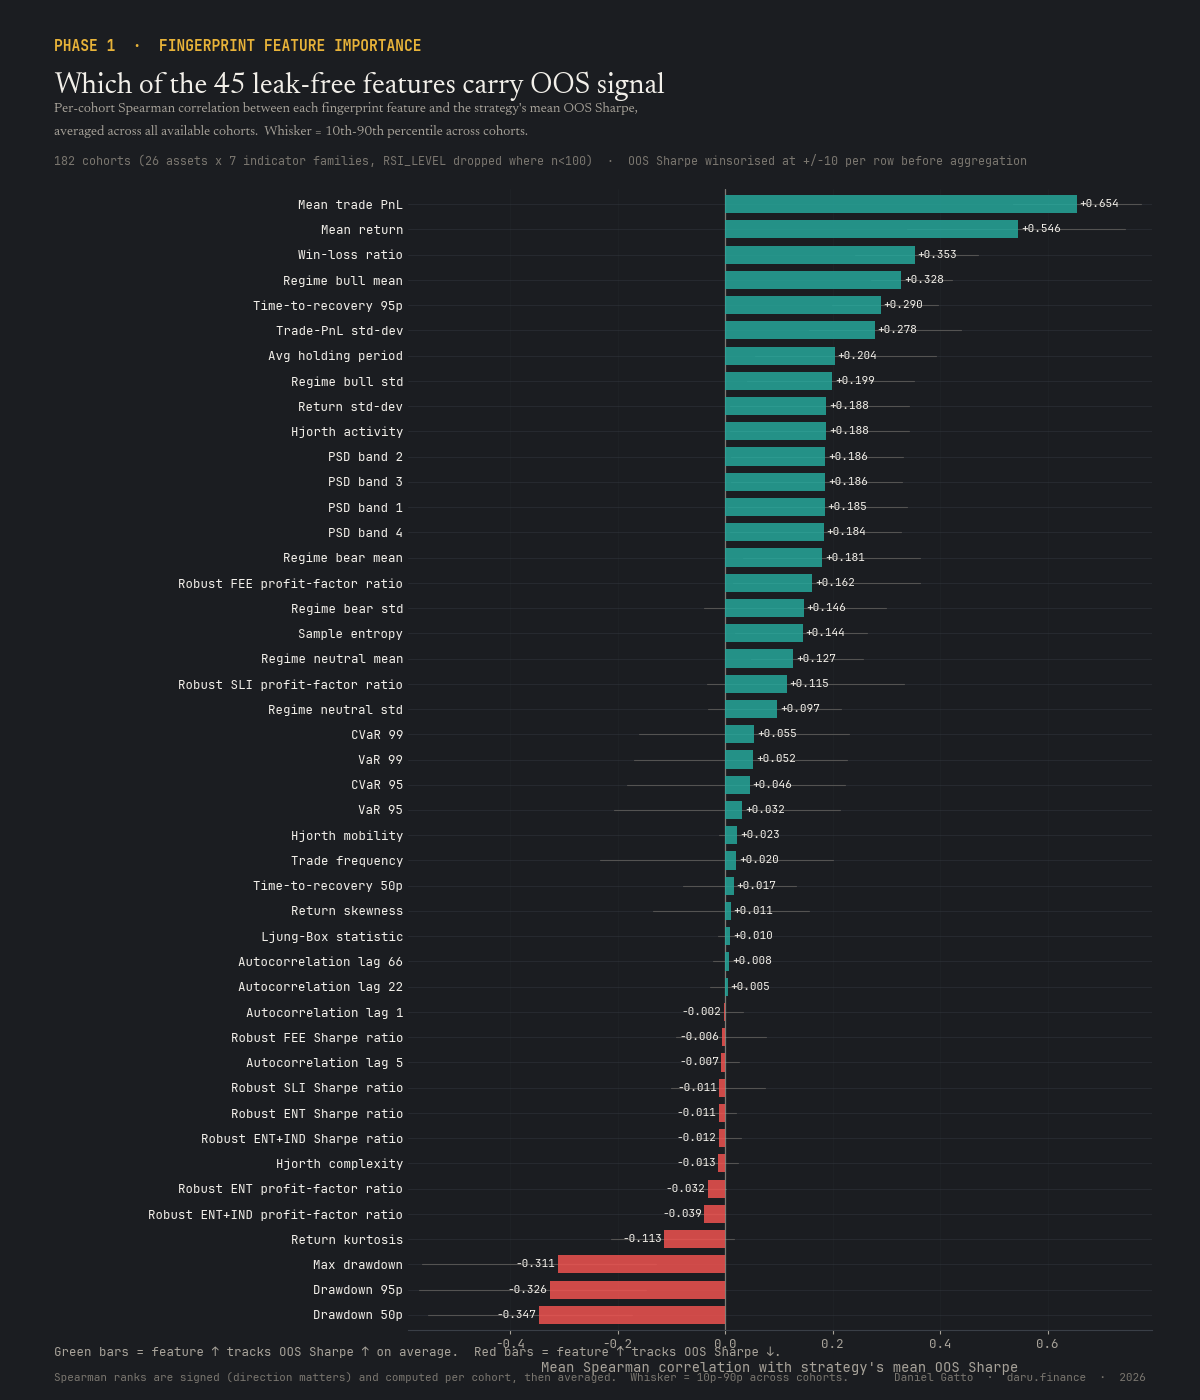
Which fingerprint components carry the OOS-Sharpe signal
Per-cohort Spearman correlation between each of the 45 behaviour-fingerprint features and the strategy's mean OOS Sharpe, averaged across all 182 cohorts. Mean trade PnL, mean return, and win-loss ratio dominate the positive side (Spearman +0.65 / +0.55 / +0.35). On the negative side, drawdown features cluster from −0.31 to −0.35 (drawdown 50p, drawdown 95p, max drawdown), strategies with worse drawdowns predict their own future underperformance.
Compute & support
Phase 04's heavy GPU work ran on rented H100s, running PersLay and the contrastive equity-curve encoders at production architecture size was not feasible on the local 8 GB VRAM workstation, so the program paid for short H100 bursts via Modal. That meant spending real money on compute to land the locked H3 verdict cleanly, and the same model applies to the remaining work, the H5 cross-asset test and the Topology Deployment Stack's H18 / H19, which will need their own short bursts.
Reproducibility and scripts
Every figure on this page is a real-output render from a self-contained Python driver, one script per figure, every locked verdict traceable to a versioned data artefact and a written verdict report. The scripts and underlying tables can be provided on request for academic or due-diligence use during the program. Public release of the full toolkit (MIT-licensed software package, Docker reproducibility container, Zenodo DOI) is part of Phase 08 and ships with the monograph at program completion, not piecemeal beforehand.
What changed in this update
Full changelog · open archived versionsThe 2026-05-14 update closes Phase I and lands a Phase II sprint mid-update on top of it. Phase I closure: H4 corpus-scale PASS at +0.61 ΔSortino over Hierarchical Risk Parity (Holm-significant, concentrated on L1-majors and the volatility-and-oscillator indicator families; statistically indistinguishable from a simple top-k-by-reliability equal-weight baseline on Sortino, so the topology contribution is coverage and audit-traceability, not raw return); H5 cross-asset universality FAIL; H20 portfolio-coverage-health monitor FAIL; failure-mode-diversity portfolio constraint FAIL with a smaller-magnitude cost than first measured; the first Mark-2 sheaf-Laplacian headline bar cleared (+0.72 ΔSortino over a naive in-sample-Sharpe-rank top-20 baseline, Holm-rejected). Phase II mid-sprint: a cohomology-gated sheaf-Tikhonov-regularised portfolio Holm-rejects that earlier headline configuration on the ALL grouping (+0.20), on the EMA family (+0.53), and on the MACD family (+0.65), and Holm-dominates three further baselines, partial second-stage win, with a clean Stage 2 follow-up to potentially close the SMA gap (where the variant missed at −0.10). The cost-capacity stability theorem ships with two complementary measures (discrete-scenario panel: temporally stable, 16.4% deployable-cost tail; continuous basis-point grid: Holm-rejected temporal drift, deployable tail 0.34%; Spearman ρ between them = 0.0491, essentially uncorrelated; they answer different deployment questions). The prediction-vs-decision theorem now stands on six independent empirical legs. Below is the explicit before / after; the full version history is on the changelog page.
Sheaf-Laplacian aggregation, partial second-stage portfolio refinement
Before
First headline bar cleared (+0.72 ΔSortino over a naive in-sample-Sharpe-rank top-20 baseline, Holm-rejected on the corpus); the next-stage refinement was open.
After
A first-cohomology-gated sheaf-Tikhonov-regularised portfolio Holm-rejects the previous deployment-scale headline configuration on the ALL grouping (+0.20 ΔSortino), on the EMA family (+0.53), and on the MACD family (+0.65); it misses the SMA family (−0.10, not Holm-rejected). The pre-registered "must clear both moving-average families" bar is half-met, a meaningful methodology refinement on top of the first headline, with a clean Stage 2 follow-up path (full λ-cross-validation, threshold tuning, per-member theory stalk) to potentially close the SMA gap. The same variant Holm-dominates three further baselines: the strict-causal H4 portfolio (+1.29), the naive Sharpe-rank top-20 (+0.92), and equal-weight reliability (+1.23). Two additional results from the same workpackage land alongside: the first-cohomology obstruction is decoupled from per-cell decision quality (Spearman ρ = −0.035; threshold ρ ≥ 0.40 not approached, a clean negative), and restricting the partition to a recent 8-walk-forward-window cover reduces the obstruction with large Holm-rejected effect sizes on both selection metrics tested.
Cost-capacity stability theorem, two complementary measures
Before
Cost-capacity invariant defined; one operationalization in flight.
After
Two complementary operationalizations have now landed, and they are not coarsenings of the same scalar. The discrete-scenario measure runs the corpus through a 5-scenario perturbation panel (baseline / fee / slippage / entry-drift / entry-drift + indicator-variance), is temporally stable per strategy (Holm-not-rejected on the per-window drift of the class), and finds a 16.4% deployable-cost tail (the strategies that survive the entire envelope); cross-cohort heterogeneity is real and Holm-rejected (L1-majors least cost-robust; alt-L1s most). The continuous-cost measure on a 9-point absolute basis-point grid {0, 2, 5, 8, 12, 20, 35, 60, 100} shrinks the deployable tail to 0.34% and surfaces a Holm-rejected temporal drift the discrete grid missed (mean cost-class shift = −0.0213 cost-class-units per window, p = 0.0008). Same per-family and per-cohort directional patterns across both (MACD most cost-fragile; EMA most robust; L1 less robust than alt-L1) but the continuous measure resolves 1.6× wider heterogeneity gaps. Spearman ρ between the two measures = 0.0491, essentially uncorrelated. The cost-capacity stability theorem therefore has two complementary measures, not one.
Prediction-vs-decision theorem, six independent empirical legs
Before
Four empirical legs (the four refinements of the partition): forecasting fails or shrinks; the grain is covariate-level; robustness is necessary but not sufficient; an added degree of freedom must be predictive of the outcome.
After
Six independent empirical legs across multiple work packages. The original four refinements that closed the partition itself, plus two new structural-invariant legs landed today: (5) the sheaf-cohomology obstruction over the strategy-cluster nerve is decoupled from per-cell decision quality (Spearman ρ = −0.035; threshold ρ ≥ 0.40 not approached, the obstruction describes cover structure, not decision-side quality), and (6) the cost-capacity invariant is temporally stable on the discrete-scenario operationalization and carries Holm-rejected cross-cohort heterogeneity, both indicating the invariant captures structural facts about strategies under friction rather than decision-side ones. The central methodology claim therefore stands on a stronger empirical foundation than at the close of Phase I.
H4 PASS lands at corpus scale
Before
H4 corpus-scale verdict pending; the deployment-scale figure was reported as a provisional first-pass result.
After
H4 PASS at corpus scale: ΔSortino vs HRP = +0.61 (95% CI [+0.39, +0.82], Holm-significant). Heterogeneous by cohort and family: the L1-majors cohort carries the corpus number (+1.20 vs HRP, Holm-rejected); outside L1-majors no §5 cohort produces a Holm-significant edge. By indicator family, ATR / MACD / Stochastic %K each Holm-rejected positive (+1.3 to +2.1 over HRP); EMA Holm-rejected negative (−0.6); RSI / SMA / PPO flat. Against a simple top-k-by-reliability equal-weight baseline the Mapper-cluster step is statistically indistinguishable on Sortino (paired Δ = −0.06, Holm-p = 0.37), so the topology contribution is coverage and audit-traceability, not raw return. Against the naive in-sample-Sharpe-ranked top-k baseline the topology Stack still loses on Sortino. The bake-off bar chart is re-rendered with the corpus-scale numbers; the central-claim, dek, scorecard, Phase-06 detail, and findings card all read the same headline.
H5 cross-asset universality verdict, FAIL
Before
H5 listed as still-in-flight (the last open Phase-I hypothesis).
After
H5 FAIL: bottleneck within-cohort / cross-cohort ratio = 1.018 (p = 0.59); Gromov–Wasserstein = 0.96 (p = 0.24). Both well above the α = 0.01 falsification rule. Behaviour-space topology does not pool across structurally-similar crypto cohorts, each asset needs its own selector; Paper D rescopes to no-universality. Phase I is now closed; every pre-registered hypothesis has landed a verdict.
H20 portfolio-coverage-health early-warning, FAIL
Before
Verdict pending in the scorecard.
After
H20 FAIL. The coverage-health alarm has a median lead of −1.0 windows against the classic drawdown trigger across 70 co-firing units in the headline h4 arm; only 2 of 70 show a positive lead; 0 of 89 cohorts produce a Holm-significant positive-lead binomial. Ships as a descriptive coverage diagnostic only, no actionable early-warning signal. Third coincident-to-lagging "something is drifting" topology signal the pilot tested (H19, the per-window aggregation-risk score, H20).
Failure-mode-diversity portfolio constraint, FAIL
Before
Verdict pending in the scorecard.
After
Failure-mode-diversity portfolio constraint FAIL, but a smaller-magnitude FAIL than the first measurement suggested. Forcing failure-mode balance drops risk-adjusted return by ΔSortino = −0.09 (95% CI [−0.16, −0.02], Holm-rejected), driven by the moving-average-family cohorts. The worst-decile drawdown deepening originally reported (~5%) does not hold under careful measurement (the strict effect is −2.9% with the 95% CI spanning zero). The failure-mode labels themselves remain useful as a descriptive portfolio audit; the hard-constraint version stays off by default.
Mark-2 sheaf-Laplacian aggregation, first headline bar cleared
Before
Mark-2 sheaf-Laplacian aggregation listed as in-flight; no Holm-rejected deployable-portfolio result yet.
After
The sheaf-Laplacian portfolio (a partition-based portfolio that interpolates between rank-by-reliability and the cluster-aware diversifier) clears its first pre-registered headline bar: +0.72 ΔSortino over a naive in-sample-Sharpe-ranked top-20 baseline on the corpus (Holm-rejected), with the largest margins on the moving-average indicator families, Holm-rejected on both EMA (+0.59) and SMA (+1.15); 6 of 7 indicator families are individually significant. This is the first deployable-portfolio Holm-rejected win against that naive baseline the program has produced. Described in the article "A topological way to build portfolios".
H19 verdict + the Deployment Stack assembled
Before
H19 (live-drift monitoring) listed as the remaining open hypothesis; the Topology Deployment Stack was a re-specified phase, not yet built.
After
H19 FAIL: a per-strategy topological-drift score does not fire before the classic drawdown trigger, median lead 0 windows, lags the trailing-Sharpe trigger by 1 window, 68% false-positive rate against a 30% bar (0 of 26 cohorts under it). A strategy that draws down changes its return distribution by virtue of having drawn down, so the geometry lights up after the fact. So there is no per-strategy drift trigger in the Stack; the actionable monitor is the cohort-level aggregation-trust check (H17 PASS), and the per-strategy drift profile ships as a visualization aid only. With H18 and H19 both closed, the Topology Deployment Stack is assembled, a ten-command CLI (map, select, portfolio, audit, monitor, refit, aggregation-check, plateau-audit, universality-check, live-adapter), with the FAIL-derived caveats baked into every relevant command's help text (six of ten carry one), a worked end-to-end example on a fresh cohort, a live adapter that hooks into an existing walk-forward pipeline with no changes to it, and the runbook / live-deployment / case-study chapters drafted. The deployment-phase node and the central-claim text are updated accordingly.
The partition's fourth refinement (H19) + two new figures
Before
The prediction-vs-decision partition carried one sufficiency clause (from H18: topology has to add a degree of freedom the standard approach lacks); the contamination-fix shift chart was the only partition figure.
After
H19 added the fourth refinement: an added degree of freedom is necessary but not sufficient, it has to be predictive of the outcome, and a 'drift' signal carries no information about future drawdown; layers 1 and 4 are the same fact from two directions (forecasting future performance is out of reach, however packaged). The partition is now a four-layer structure, forecasting fails or shrinks → covariate-level grain → adds-a-degree-of-freedom necessity → predictive-degree-of-freedom necessity, and the new four-layer partition map (with the survivors banner: the Mapper-cluster portfolio, the cohort-aggregation diagnostic, the regime-rotation policy) is embedded on the central finding. A second new figure, the Deployment Stack decision-flow diagram (the five-box spine; the prune element absorbed into select; the per-strategy drift profile struck), is embedded on the H19 / Stack finding.
Phase 07 (extended directions), H14 + H15 verdicts
Before
H14 / H15 listed as still to run.
After
H14 MARGINAL (a geometric-outlier overfit-flag is a triage complement to the classical detectors, not a replacement). H15 FAIL (topology is reliably worse than the classical ex-ante metrics at predicting catastrophic strategy failure, held-out C-index ≈ 0.57–0.60 vs 0.77–0.79; the failure event has a sharp signature the standard scorecard captures directly). With H12 (marginal, Paper F) these were the last of the six; the extended-research directions are complete and Phase 07 is marked done.
Deployment Stack extension, H18 verdict
Before
The pipeline staged a standalone `prune` step; H18 / H19 listed as feeding hypotheses.
After
H18 FAIL: there is no topology-aware-pruning step that improves on running the H4 portfolio constructor against the full backtest corpus, the selector already exploits the same structure, so pre-pruning its input only removes its options. The pipeline's `prune` stage collapses into `select` (it is now map → select → diversify → monitor → pause/refit); `topo-prune` survives only as an optional human-attention shortlist diagnostic. Recommendation: don't pre-prune; feed the selector your full corpus. H19 (live-drift monitoring) is the remaining open hypothesis. The H18 result sharpened the central finding into a sufficiency condition (see below).
Central finding promoted (+ a sufficiency clause)
Before
The page led with H4 PASS as the headline practical result; the contamination-fix two-class split was a sub-finding.
After
The prediction-vs-decision partition, geometric-outlier covariates are robust (and carry every headline contribution: the H4 portfolio constructor, the H17 aggregation diagnostic, the H12 rotation policy); target-regression covariates shrink or fail; local persistent homology on a smooth manifold is dead weight, is now stated as the program's central methodological finding (dek, central-claim text, a new top finding) and captured by a new paper, Paper H. H18 added the sufficiency clause: surviving the data-cleaning fix is necessary but not enough, topology has to also add a degree of freedom the standard approach doesn't already have. H4 PASS remains the headline practical result.
Phase 06, the deployment phase
Before
Generic 'practitioner workflow & live deployment' with a CLI-surface list.
After
Re-specified as the Topology Deployment Stack: map → select → diversify → monitor → pause/refit, built entirely from the robust geometric-outlier primitives (the `prune` stage collapsed into `select` after H18 FAIL; `topo-prune` survives as an optional shortlist diagnostic). H19 (live-drift monitoring) is the remaining open hypothesis. Output portfolio grows to eight papers; the software package is now named.
Changelog archive links
Before
The v2 / v3 changelog entries had no archive route files → clicking them 404'd.
After
Archive route files added for v2, v3, and the new v4, the changelog links now resolve to a version summary (the v1 entry remains a full page snapshot; v2–v4 are structured summaries of what each version was).
Phase 06, Topo-aware portfolios (H4) finished
Before
ELEVATED to next-active; H4 not yet run.
After
FINISHED 2026-05-11. H4 PASS at corpus scale (see the H4 entry above for the up-to-date verdict and the per-cohort / per-family heterogeneity).
Phase 07, Extended directions (H12–H17)
Before
All six extension hypotheses listed as planned; no verdicts.
After
All six landed by 2026-05-11. H17 PASS (cohort persistence-trajectory dynamics predict OOS stability, segment-count × stability ρ = +0.72, the first extended-directions hypothesis to clear PASS). H13 MARGINAL (graph-Laplacian smoothing positive in 94.5% of 182 cohorts but small; ships as a MACD-only smoothing layer). H16 MARGINAL (geometry-aware coverage doesn't beat the Mapper portfolio, but surfaced the quality-aware-vs-quality-blind-coverage finding). H14 MARGINAL (geometric-outlier overfit-flag is a triage complement, not a replacement). H15 FAIL (topology reliably worse than classical features at hazard prediction). H12 MARGINAL (the topological regime detector is null but the cohort-rotation policy that consumes the detected state works).
Central claim & dek
Before
Dek read "the make-or-break test (H3) just landed, and it failed; the program is reframing"; the claim text listed claim (b) (better drawdown profiles than HRP/NCO) as a surviving hope.
After
Dek leads with H4 PASS at corpus scale. The claim text now states claim (b) is supported at corpus scale, not just pending; claims (c) and (d) plus the H12/H14/H15 extensions remain in progress.
Project dates
Before
Implicit; status caption read "Status as of 2026-05-09, Phase 1 first-light findings live in the program log".
After
Explicit: Project started 2026-05-08 · Last updated 2026-05-11. Each phase carries its own completion date.
Phase 01, Foundations & pilot
Before
Marked in-flight ("Phase 1 first-light underway"). Pilot reproducibility framed as a forthcoming gate.
After
FINISHED 2026-05-09 (Day 1). 127,879 strategies parsed, 50-D fingerprint shipped, distance matrices scaled, smooth-manifold finding locked, pre-registration manifest frozen. Phase gate cleared.
Phase 02, Geometric analysis
Before
Planned. "Kicks off after Phase 1 lock."
After
FINISHED 2026-05-09 (Day 1, same-day as Phase 01). H1 PASS (meta ΔR² = +0.130, p < 1×10⁻³⁰⁰, 180/182 cohorts Holm-reject). H2 FALSIFIED across three plateau methods, and the behavior-space salvage attempt died under window-causal correction (+0.236 → +0.0705).
Phase 03, Persistent topology + H3
Before
Planned. "The core TDA contribution." Make-or-break framed as a future test.
After
FINISHED 2026-05-10 (Day 2). H3 FALSIFIED. Meta-FE ΔR²(B8 − B2) = −0.0378, Holm-adjusted p = 1.07 × 10⁻⁵, 5/5 cohorts negative. Multi-method, multi-feature falsification across two feature representations and three architecture families.
Phase 04, Local homology + Fisher–Rao
Before
Planned as the H10 + H11 chapter of Part IV.
After
Deprioritised after H3 FAIL. The hypotheses were elaborations of the H3 thesis; with H3 dead, the prior on H10/H11 adding non-redundant signal drops sharply. Plateau-detection survives as a per-strategy diagnostic only.
Phase 05, Topo-aware portfolios + universality
Before
Planned. Listed as "applied half of Part IV."
After
ELEVATED to the program's highest-EV remaining test. Independent of the H3 falsification (it tests portfolio construction, not per-strategy level prediction). H4 (Mapper-cluster portfolios) becomes the next active phase.
Phase 07, Extended research directions (NEW)
Before
Did not exist.
After
New phase added 2026-05-10 covering six new hypotheses (H12 regime detection · H13 performance diffusion · H14 anomaly detection · H15 topological hazard · H16 geometry-aware diversification · H17 persistence-trajectory dynamics). H16 is flagged as the highest-EV remaining direction.
Roadmap structure
Before
7 macro phases (Foundations, Geometric, Persistent, Local, Portfolio, Workflow, Synthesis).
After
8 macro phases. Phase 07 (Extended research directions) inserted between Workflow and Synthesis; original Synthesis renumbered to 08.
Output portfolio
Before
5 papers + 1 monograph + 1 software package + 5 interactive visualisations + Zenodo DOI.
After
7 papers + 1 monograph + 1 software package + ≥7 interactive visualisations + Zenodo DOI. Added: Paper F (regime topology), Paper G (geometry-aware portfolio + topological fragility).
Figures
Before
Two illustrative SVG demo components: "PersistenceDiagramFigure" and "MapperGraphFigure".
After
19 real-output renders embedded across the phases and findings sections (the 13 from the earlier update plus six new ones for the H4 PASS, the H4 drawdown profile, H13, H16, H17, and the two-class partition figure). Demo SVG components removed. Each figure carries a footer with source-data lineage; the production scripts are available on request.
Compute and support
Before
Not addressed.
After
Rented H100 compute used for Phase 04's deep-learning baselines (PersLay, contrastive equity-curve encoders), real money was spent, and Phase 05 + Phase 07 will need more bursts. Research-support page linked for anyone who'd like to help fund that compute.
Make-or-break, falsification, scope
Make-or-break test
H3 against the modern-ML baseline stack (XGBoost, TabPFN, TS2Vec, contrastive equity-curve encoder, and their stacked ensemble). If incremental adj-R² < 0.03, the topology stack does not earn its place, and the program reframes Part V around topology as an enrichment of an ML pipeline rather than a replacement.
Multiple-testing
Holm–Bonferroni FWER ≤ 0.05 across the 11 primary hypotheses. The 3-asset pilot is QA-only and does not enter the final inference; pre-registration is locked at the end of Phase 1.
Scope decisions
Crypto-only for v1. Hybrid strategy-space (per-family parameter + unified behavior). No theoretical novelty pursued, sheaves and information-geometry used as applied analysis tools that produce scalars feeding downstream decisions.