

RESEARCH · SYSTEMS
A Reproducible Walk-Forward Backtester
Cross-language parity, regime segmentation and robustness stress testing for systematic trading research.
A research-grade backtester implemented in Python and Rust. Cross-language parity detects differences between the two implementations, while the research controls address walk-forward testing, realistic costs and robustness. The code is open source under Apache 2.0. Bundled fixtures run without a download; the 150,000-candle benchmark has a separate reproducible data recipe.
SSRN Working Paper
Under review, not yet posted.
Source on GitHub
github.com/DaruFinance/quant-research-framework-rs
In short
Full walk-forward run
7.20 s Rust · 112.37 s Python
One 150,000-candle batch covered 10 fixed configurations and 28 walk-forward windows. Rust was 15.61× faster in this observation, with identical Rust ledgers before and after the buffered-write fix.
Matched execution
4 engines · 20,137 trades each
A separate frozen-event test compared QRF Rust, QRF Python, Backtesting.py and vectorbt on the same long-only orders. Trade chronology and prices matched, with normalized P&L within 7.28e-12.
Parity
Differences become test failures
The Python and Rust implementations are checked against each other across deterministic configurations. Comparing their outputs can reveal porting errors, but it does not prove an edge or eliminate common-mode mistakes.
What this is
Most open-source backtesters provide an execution loop and leave the research discipline to the user: how to separate in-sample from out-of-sample data, whether indicators can see the future and how results change after fees, slippage and funding. This framework puts those controls into the engine through walk-forward optimisation, regime segmentation, realism settings and a five-scenario robustness suite. A trade-ledger invariant prevents a strategy from trading on a bar that has not closed.
The same specification is implemented in Python and Rust, then compared point by point. That parity layer detects cross-implementation differences; it does not establish profitable edge or protect against a mistake shared by both implementations. The figures below separate historical research output from the September 2026 performance measurements.
How it fits together
Data passes through a shared indicator core into a strategy contract that returns one signal per bar. The execution core applies costs, then the walk-forward orchestrator re-optimises and forward-tests each window. At the end, the parity harness compares the two implementations' metric ledgers.
Walk-forward, by construction
Each iteration optimises on a rolling in-sample window, tests on the next out-of-sample sub-window and advances. No window is scored on the observations used to fit it.
What a run produces
The historical example in this section uses the bundled EMA-crossover strategy on SOL/USDT 1h. It emits optimised in-sample and out-of-sample reports, five robustness scenarios and 18 rolling walk-forward windows. These figures belong to that example, not to the later 150,000-candle performance tests.
The example loses money, which makes the controls easier to inspect: each output shows where a weak strategy fails instead of turning it into a trading recommendation.
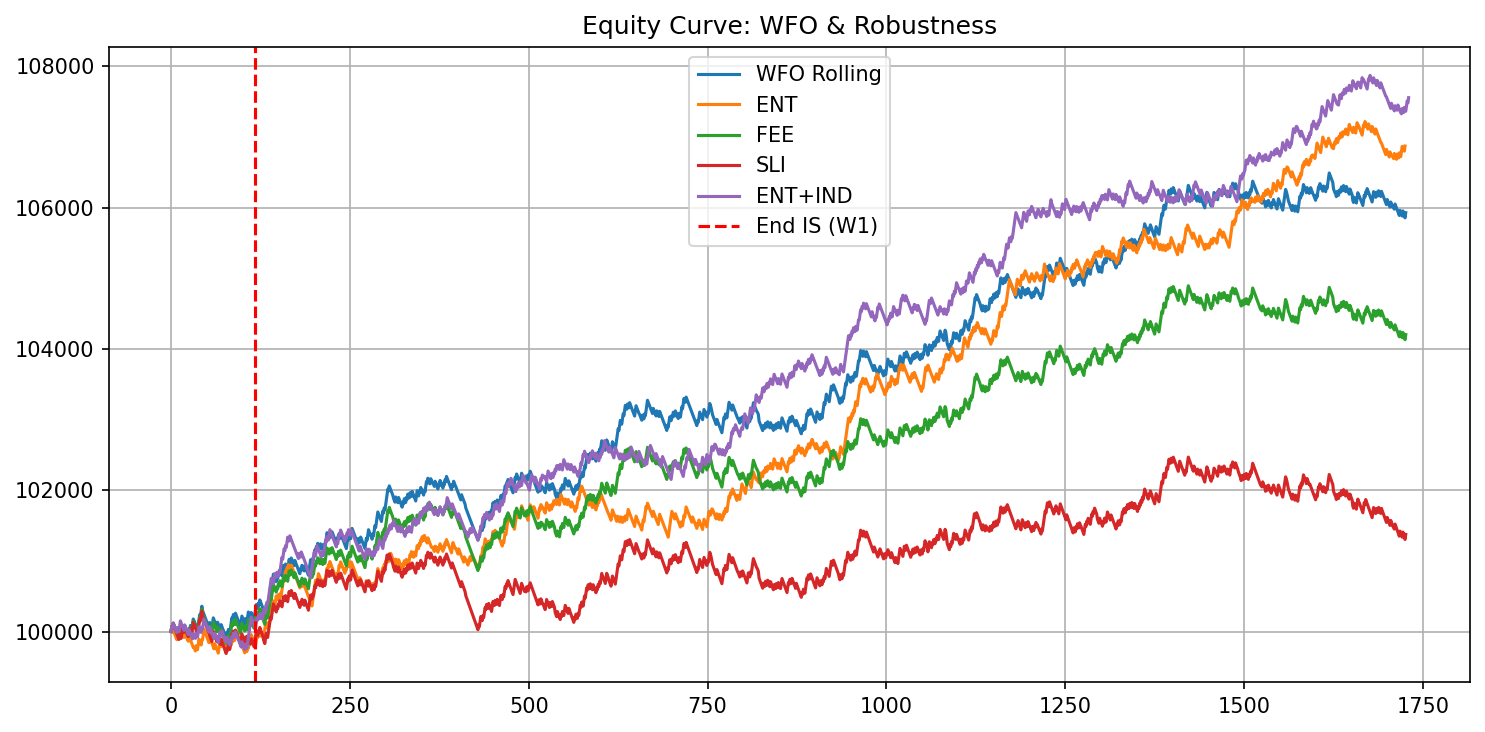
The stitched walk-forward curve rises in this historical example while each in-sample window selects a new lookback before the next out-of-sample test. That procedure does not guarantee a rising curve, so the aggregate and deflation checks remain necessary.
The metrics it prints
The optimised out-of-sample Sharpe is -2.91 after costs in this example.
  IS-opt  (LB 47) | Trades: 118   ROI: $-735.77     PF: 0.61   Sharpe: -2.69   MaxDD: $804.82
 OOS-opt  (LB 47) | Trades: 755   ROI: $-2,077.85   PF: 0.81   Sharpe: -2.91   MaxDD: $2,258.93
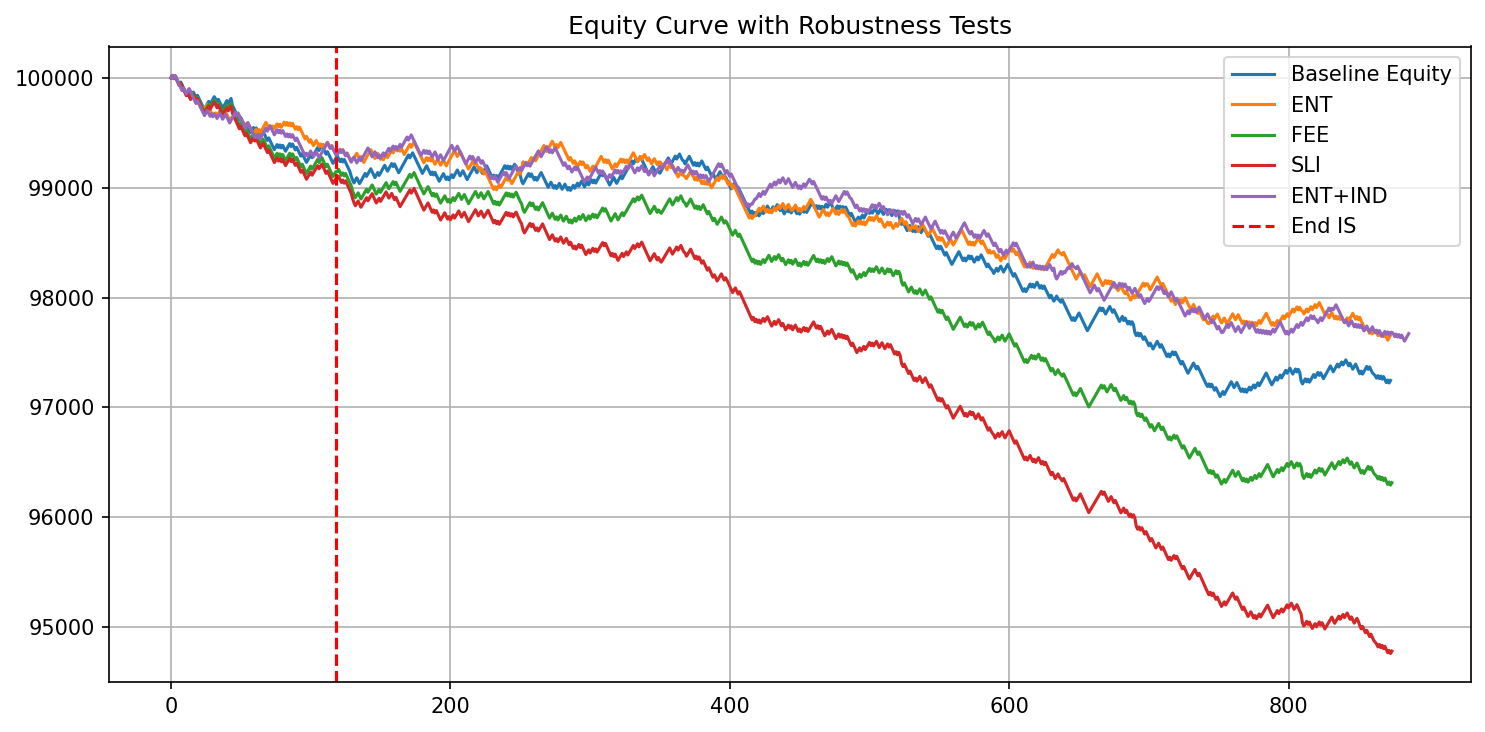
The robustness sweep reruns the optimised baseline under four perturbations. The slippage shock is the worst case, while a one-bar entry delay changes less; their spread records sensitivity to assumptions outside the strategy's control.
 Baseline OOS | ROI: $-2,077.85   PF: 0.81   Sharpe: -2.91   MaxDD: $2,258.93
     ENT OOS | ROI: $-1,623.33   PF: 0.84   Sharpe: -2.30   MaxDD: $1,809.32   entry drift +1 bar
     FEE OOS | ROI: $-2,832.73   PF: 0.74   Sharpe: -3.99   MaxDD: $2,876.37   fees x2
     SLI OOS | ROI: $-4,303.79   PF: 0.64   Sharpe: -6.11   MaxDD: $4,346.15   slippage shock
 ENT+IND OOS | ROI: $-1,629.68   PF: 0.85   Sharpe: -2.29   MaxDD: $1,875.23   drift + indicator jitter
The rolling report shows each window separately. W01 gains $899.57 out of sample, but later windows and the pooled result determine whether the strategy survives evaluation.
 Running Walk-Forward Windows
  W01 IS  (LB 47) | Trades: 118   ROI: $308.25   PF: 1.14   Sharpe:  0.63   MaxDD: $448.35
 W01 OOS  (LB 47) | Trades:  92   ROI: $899.57   PF: 1.57   Sharpe:  1.95   MaxDD: $243.77
  ...   W02 through W18 each re-optimise on the rolling in-sample window
        and forward-test the next window on data they never saw   ...
Three Monte Carlo modes
The queue makes the sampling rule explicit. Trade permutation reorders completed returns without replacement. Trade resampling draws them with replacement. Bar permutation rebuilds OHLCV paths, then regenerates signals and reruns a frozen strategy and parameter set on every path. Each selected mode produces its own result, and bar mode is not triggered by the ordinary trade-return API.
Input
01Completed trade returns
Sampling rule
02Shuffle without replacement. Every realised trade appears exactly once.
Evaluation
03Recompute path-dependent metrics from the reordered trade path; do not rerun the strategy.
Saved output
04Trade-level Monte Carlo summary for the requested seed and run count.
Bar permutation is expensive: its 500-run default means hundreds of complete backtests. The built-in EMA strategy uses the repository's Rust worker in both packages; a custom Python strategy uses the explicit Python callback path.
Consistency is Daniel Gatto's custom optimisation-score example, not a standard finance metric. Users can replace its calculation and objective lookup in code with their own score.
Performance, measured two ways
The first panel measures a complete walk-forward batch on 150,000 real BTCUSDT spot 30-minute candles: 5 strategy families, each at 2 fixed lookbacks, across 28 out-of-sample windows. The second isolates a shared execution contract across 4 engines using frozen order events. They answer different questions and their ratios are not interchangeable. Benchmark method, raw results and data recipe.
Cross-language parity
The historical parity record below covers 210 deterministic-core metric points from 3 configuration surfaces. It is separate from the new 10-configuration benchmarks, whose full walk-forward metrics differed by at most 6.66e-14 and whose matched-execution ledgers agreed on chronology, side, prices and normalized quantity.
How it compares
Each capability exists in other backtesters. This project combines them and makes the research controls enforceable rather than optional convention.
The full feature set
PBO and DSR lead the list because they test whether an optimised result deserves further attention. The labels below distinguish the core pipeline, opt-in reports, standalone APIs and optional packages.
Clone it and inspect the bundled examples
The commands below use the sample data included with the repository, so they require no API key or download. The 150,000-candle performance benchmark is separate and uses the reproducible data recipe linked from the benchmark documentation.
Bundled strategies demonstrate the pipeline rather than claim a tradeable edge. Out-of-sample losses after costs are evidence that the engine exposes a weak strategy instead of hiding it.
Citation
The accompanying paper is under review at SSRN. Until it is posted, cite the framework from its repository.
See also
Read within-strategy permutation testing for the selection method this backtester supports, then visit the Research Review for independent reproductions built around walk-forward and deflation-aware evaluation.